
![salary needed to buy a home in every US county, based on real mortgage math [OC]](https://www.byteseu.com/wp-content/uploads/2026/03/tnpffmb9cgog1-1536x960.jpeg "salary needed to buy a home in every US county, based on real mortgage math [OC]")
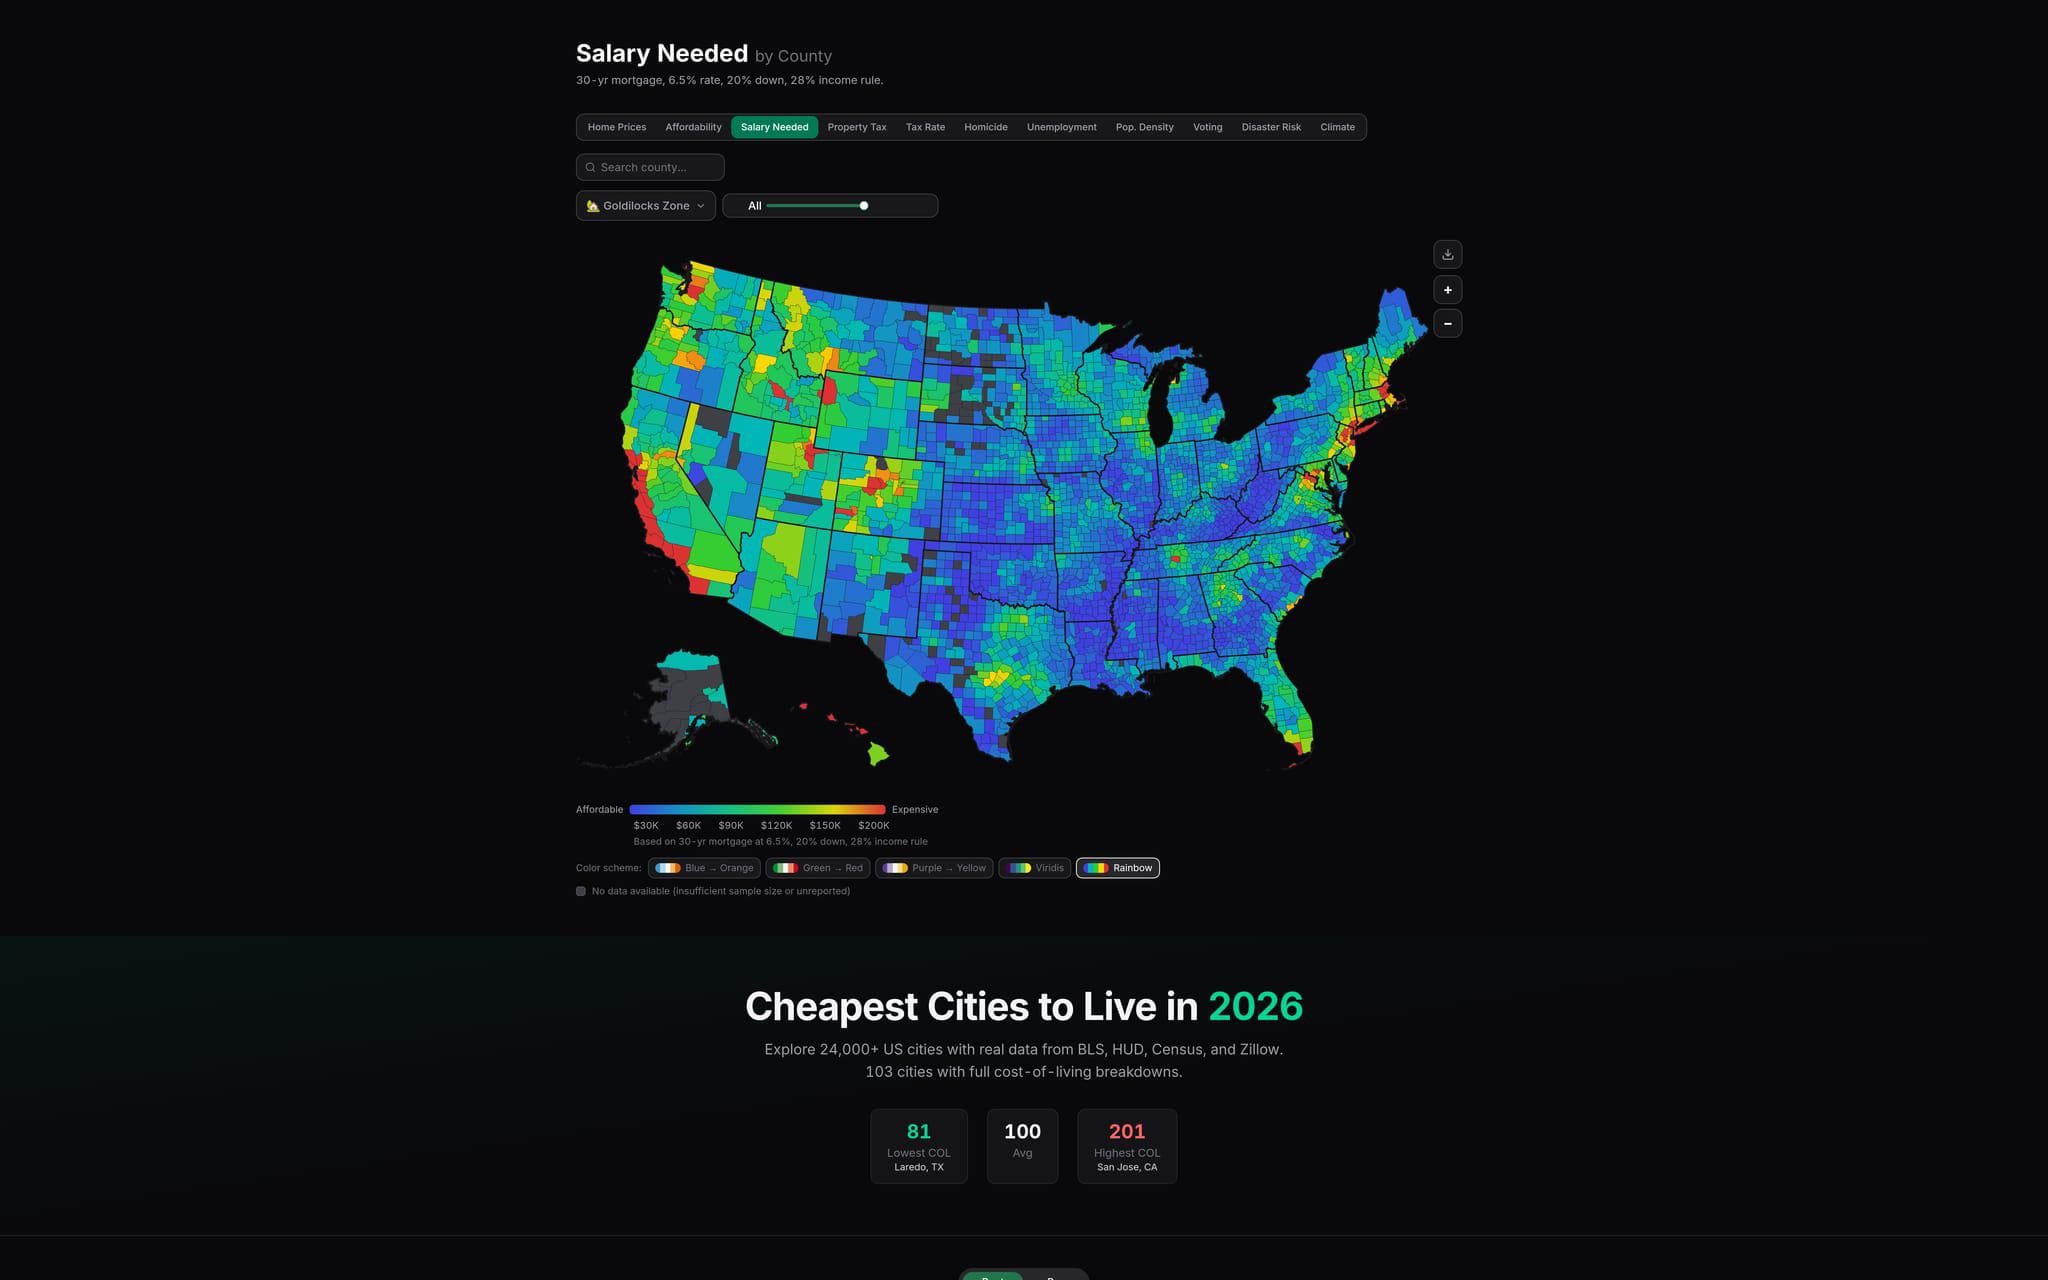
built this as part of a free tool at movenumbers.com. you can set your own salary to see which counties you can afford, plus there's a bunch of other map layers – property tax, walkability, crime, where people are migrating to, voting patterns, climate, disaster risk. all real federal data.
https://movenumbers.com/explore?map=salary-needed
sources: Zillow ZHVI (home prices), Census ACS 2023 (property tax, income), 30-yr fixed mortgage at 6.5%, 20% down, 28% DTI rule. tool: next.js + d3
Posted by supleezy
12 Comments
Before people start saying people in the red areas should just move, keep in mind the red areas have a LOT more jobs available.
Is the Nashville area referencing salary for home ownership or bachelorette party volume?
A median home? Have you got percentile prices for different places?
It’s OK to have roommates or live with family. You don’t need a 3,000 sq ft detached house just for yourself. Multi generational households are the norm, the 2nd half of the 20th century in America was the aberration.
Ayyy, glad you used my comment on that other sub and ran with it. Looks great now 🙂
This is really neat!
One potential confound though – in places like NYC where a large percentage of people live in condos or co-op buildings there are common charges/maintenance that from what I can tell aren’t accounted for here. They can run from the many hundreds to the many thousands a month, depending on how fancy a building is. That may skew NYC costs lower than they actually are.
This is giving massive AI vibes
I know I’m a bit of an outlier cuz I live in a military town but it’s basically the only thing in my county and that county 1000% is not “30k salary for a house”
You can’t find anything for under $200k here, someone making $30k (the graphs take) would never even be able to save the 20% it assumes the home buyer has in this situation
Edit: yeah looking at other areas of my state idk how any of this makes any sense lol, there are entire blue sections that I know *for a fact* you damn near gotta be a millionaire to live in
Calling BS on this graph at least
The sharp color boundary at the KY-TN border is really interesting.
All the red counties are the only ones I would consider living in 😭
20 percent down? That’s like a college tuition
Whole state is basically blue, except the one yellow area where I live. They found us during covid and we’re fucked.