
![[OC] Fatal risk profile of major US highways: 1975 - 2023](https://www.byteseu.com/wp-content/uploads/2026/03/j33nbc8o29pg1-1536x864.gif "[OC] Fatal risk profile of major US highways: 1975 – 2023")
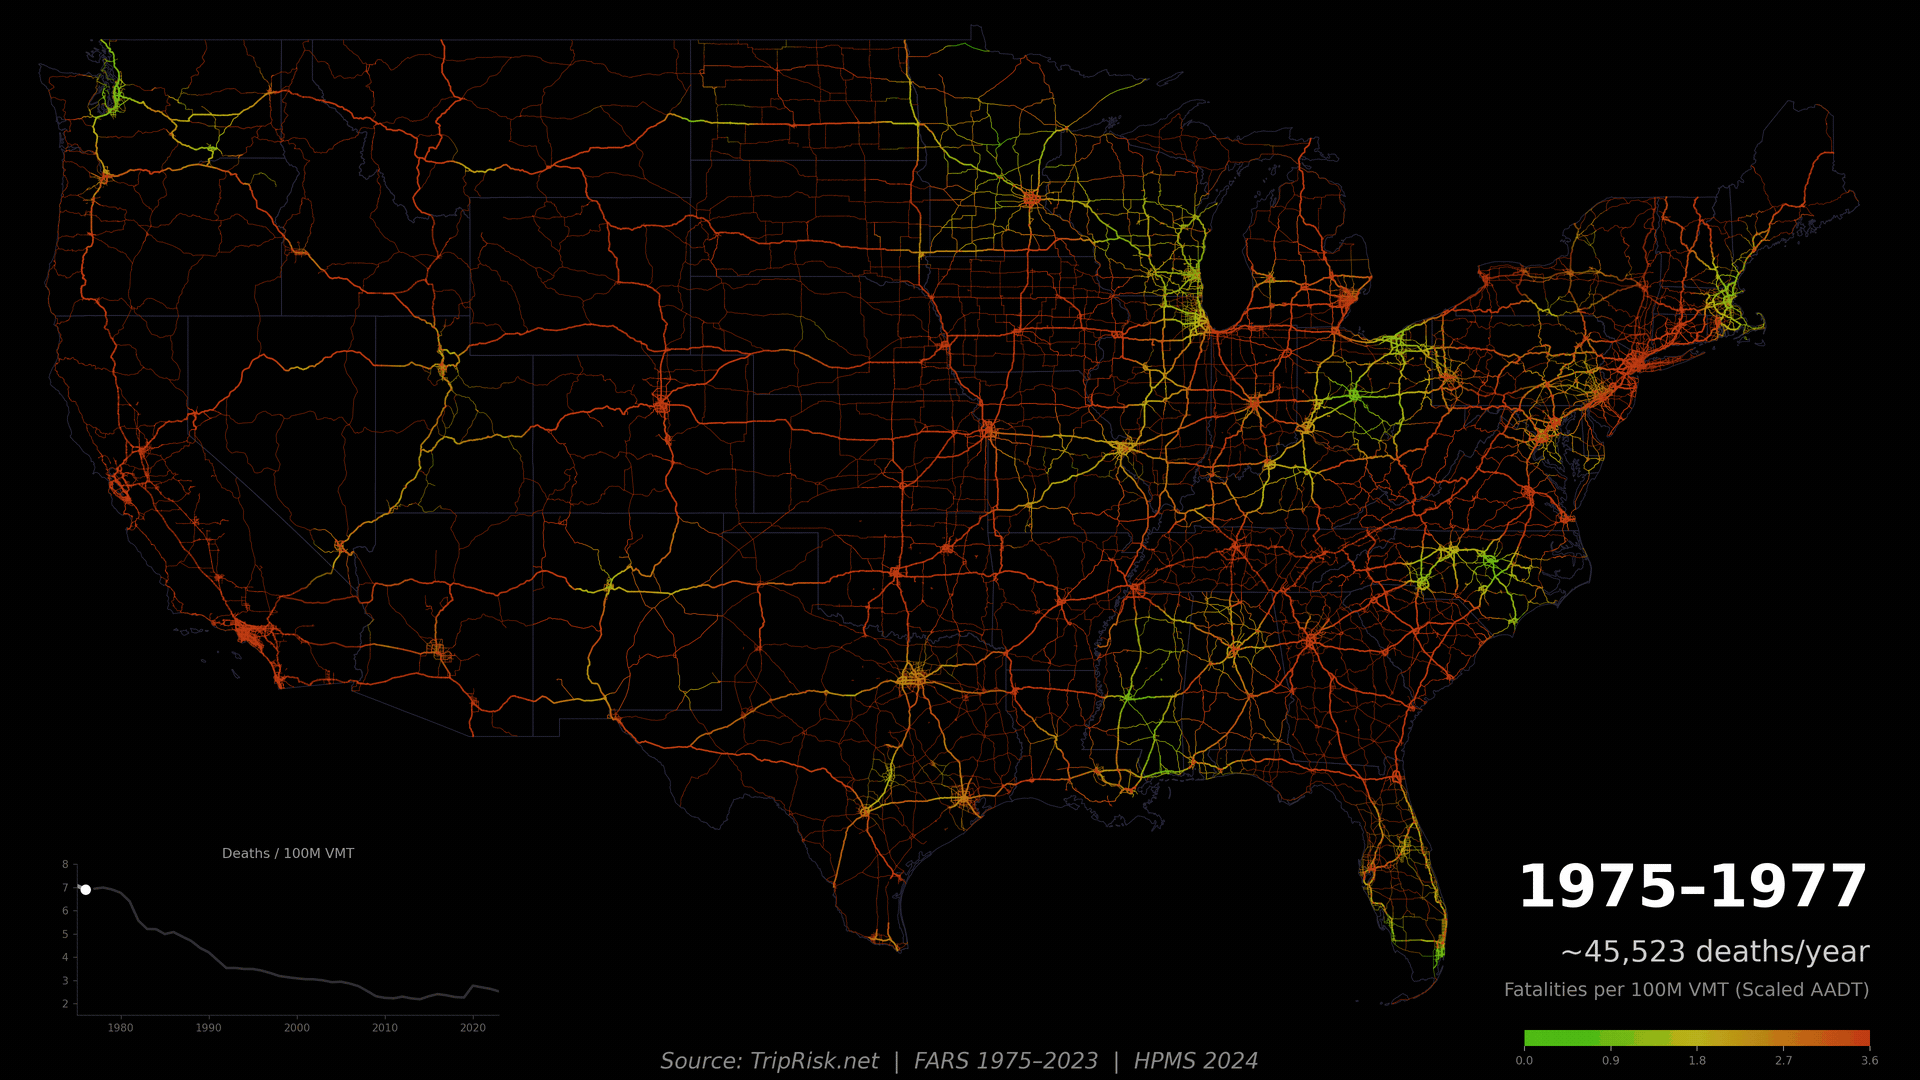
The normalized fatal risk across US highways has decreased significantly over the last 50 years.
Fatal crash locations from NHTSA's Fatality Analysis Reporting System (FARS, 1975-2023) were snapped to major road segments (Interstate, Freeway, and Principal Arterial) from the 2024 Highway Performance Monitoring System (HPMS). Each frame shows a 3-year rolling average of the fatality rate per 100 million vehicle miles traveled, with historical traffic volumes estimated by scaling 2024 HPMS AADT using state-level VMT ratios from FHWA Highway Statistics. Risk values were spatially smoothed with a 0.15-degree Gaussian kernel.
1.8M fatal crash records, 2M total deaths, 180M segment-level data points
Posted by jejmcjej
7 Comments
Notice the first couple of years deaths and the last couple are about the same (43k+). I’m assuming the number of miles drove really increased in the time frame
What’s going on in California for it to be so bad there?
That’s pretty interesting. There is a clear regional pattern, makes me wonder what was happening
… only 3 upvotes? This thing looks like the kind of thing I’d see with like 30k upvotes woah
What’s up with Sacramento, CA?
I would assume it’s less about improving or adding safety measures to the infrastructure and more about cars having traditional airbags and side impact airbags, automatic braking, traction control, seat belts, and made to crumple instead of just being heaps of steel….
Think about the cars from the 70’s and early 80’s versus today….
Was the nearest increase due to Covid?