
![[OC] I visualised a real underground fungal network connecting 67 trees in a forest — the "Wood Wide Web"](https://www.byteseu.com/wp-content/uploads/2026/03/verl4klh9npg1-1536x907.png "[OC] I visualised a real underground fungal network connecting 67 trees in a forest — the “Wood Wide Web”")
This is an interactive 3D visualisation of a real mycorrhizal fungal network mapped by researchers in a 30x30m Douglas fir forest plot in British Columbia.
What you're seeing:
– 67 trees connected by 220 fungal links through 27 distinct fungal organisms (genets)
– The largest hub tree ("mother tree") has 47 connections — linked to 70% of the plot
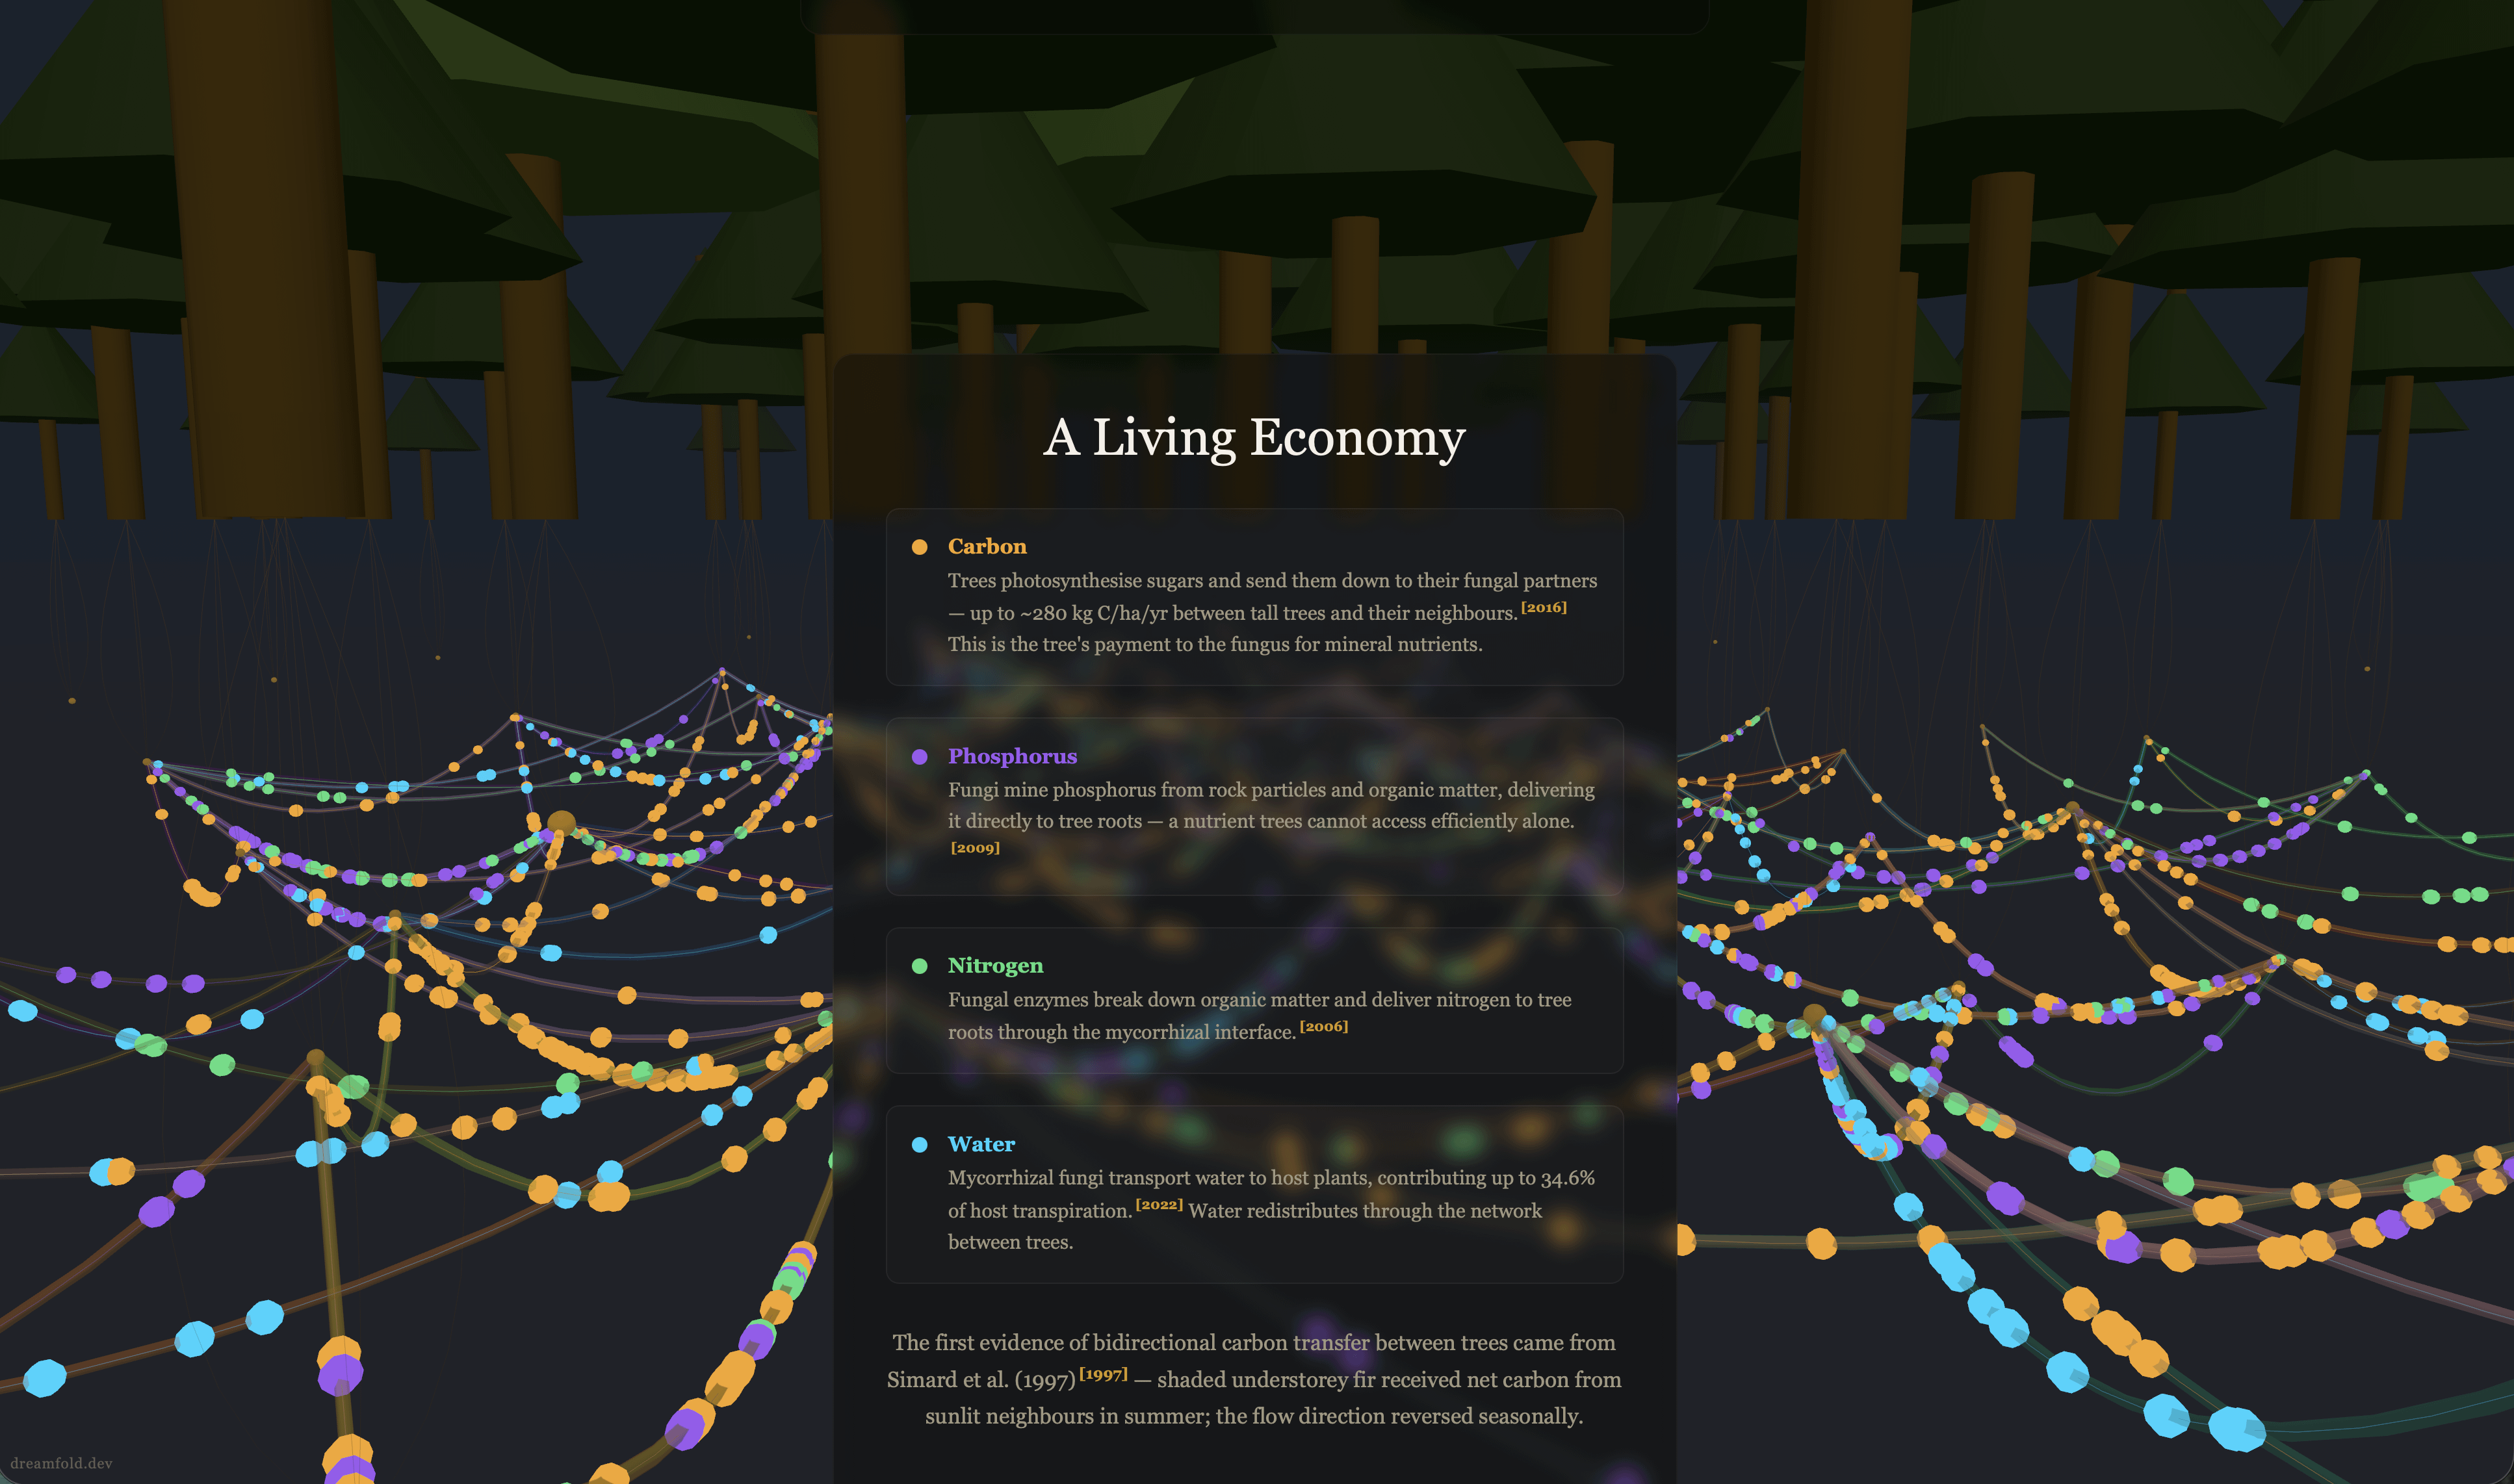
– Fungi trade carbon, phosphorus, nitrogen, and water between trees — the direction and volume shifts with the seasons
– Veteran trees are net carbon donors; saplings are net receivers
– Some connections are scientifically well-established (green edges), others are demonstrated but debated (amber), and a few are contested (red)
Interactive features:
– Scroll through a 7-section narrative explaining the science
– Then switch to explore mode: toggle nutrient types, change seasons, click fungal genets to highlight entire organisms, Shift+click a tree to trigger a defence signal cascade through the network
– Confidence overlay shows evidence strength for each connection
Posted by darryl-c
3 Comments
*Data* *source:* *Beiler* *et* *al.* *(2010)* *”Architecture* *of* *the* *wood-wide* *web”* *and* *Beiler* *et* *al.* *(2015),* *mapping* *multi-species* *fungal* *networks* *via* *genotyping* *of* *root* *tips.* *67* *Douglas* *fir* *trees,* *27* *Rhizopogon* *genets,* *220* *edges.* *Dataset* *enhanced* *with* *cohort* *classifications,* *depth* *ranges,* *nutrient* *directionality,* *and* *confidence* *levels* *derived* *from* *Simard* *et* *al.* *(1997,* *2012),* *Klein* *et* *al.* *(2016),* *and* *16* *other* *peer-reviewed* *papers* *cited* *in* *the* *app’s* *sources* *panel.*
*Tools:* *React* *19,* *Three.js* *(via* *React* *Three* *Fiber),* *TypeScript,* *Zustand,* *Vite.* *Graph* *layout* *computed* *from* *the* *original* *spatial* *coordinates* *with* *force-directed* *edge* *routing.* *All* *rendering* *runs* *client-side* *—* *no* *backend.*
Really love this presentation! Out of curiosity, do you know which forest in BC the data comes from?
The interactive web site is amazing. The visualization looks lovely, and is fascinating to explore. My favorite view is from below, so the tree geometry doesn’t get in the way.
I did find one bug. If you turn off all but one exchanged resource, such as water, then eventually all the moving points disappear. For some reason, this does not happen when all four resources are turned on.