
![[OC] Flight activity of a single RyanAir aircraft over the past 3 years](https://www.byteseu.com/wp-content/uploads/2026/03/pjijzo8us9qg1-1536x864.png "[OC] Flight activity of a single RyanAir aircraft over the past 3 years")
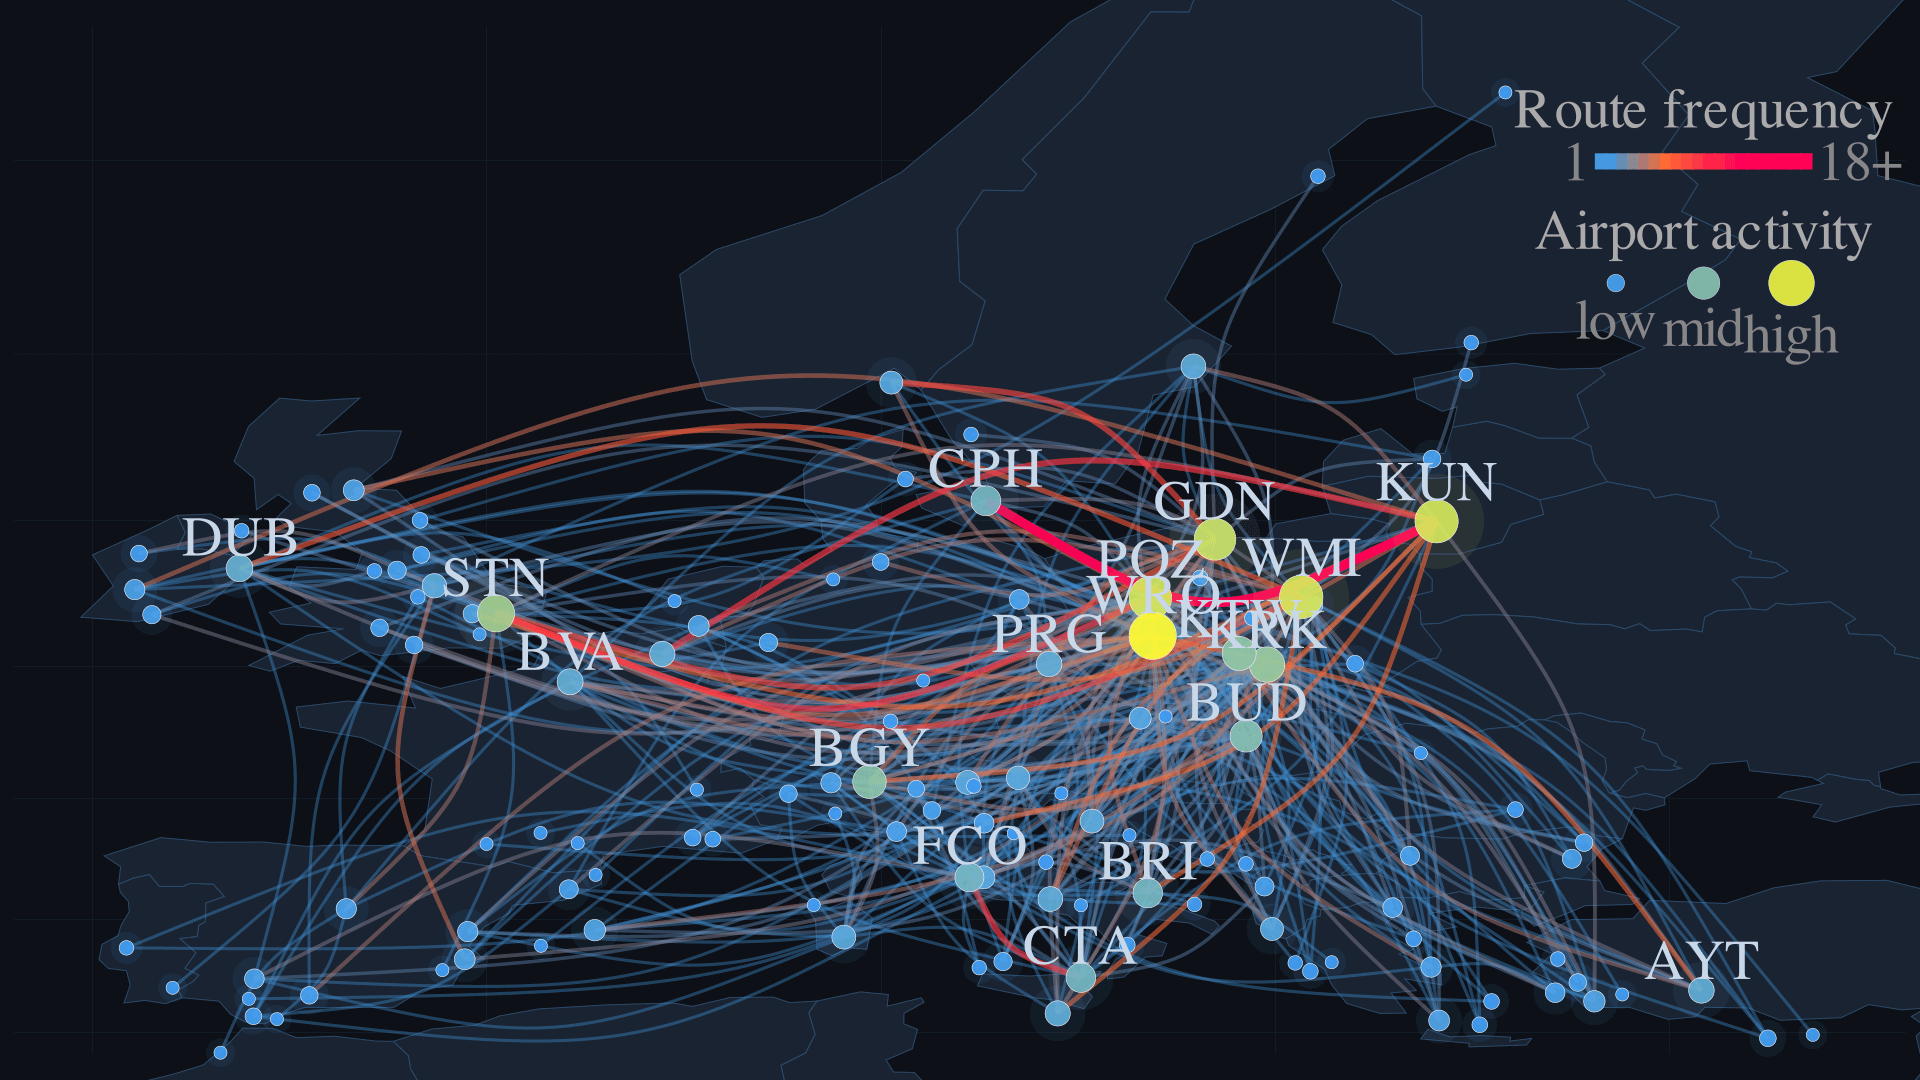
I used a Manim python script for the image and FlightRadar24 for Airplane SP_RKU's flight history for the last 3 years. (it's a 8 year old 737)
The 18 labelled airports are the 18 most commonly travelled.
Each movement represents a recorded flight between airports. This singular airplane had 5944 recorded flights since March 17, 2023.
This visualization is part of a video I was making where I analyzed delay patterns and EU261 compensation. https://www.youtube.com/watch?v=S1J8rx2Jw98
Posted by dser89
5 Comments
Average of more than 8 flights every single day for two years is wild.
edit: oh wait, it’s 2026 😅 5-6ish a day for three years.
Is this a completely random aircraft you chose?
5944 flights since 2023 seems insane, holy shit!
If you’re interested in data analysis, you should check out tools like Pandas for working with data frames and Matplotlib for making visuals in Python. Since you’re already using Manim, it seems like you’re familiar with Python scripting, which is awesome. If you need help organizing your analysis for presentations or discussions, look for online resources or communities that focus on data visualization or aviation analytics. Good luck with your video!
And yet, being Ryanair, at no point was it within one hour of a city.
Insane choice of globe viewing angel for a “beautiful” visualization. Why is it so flat