
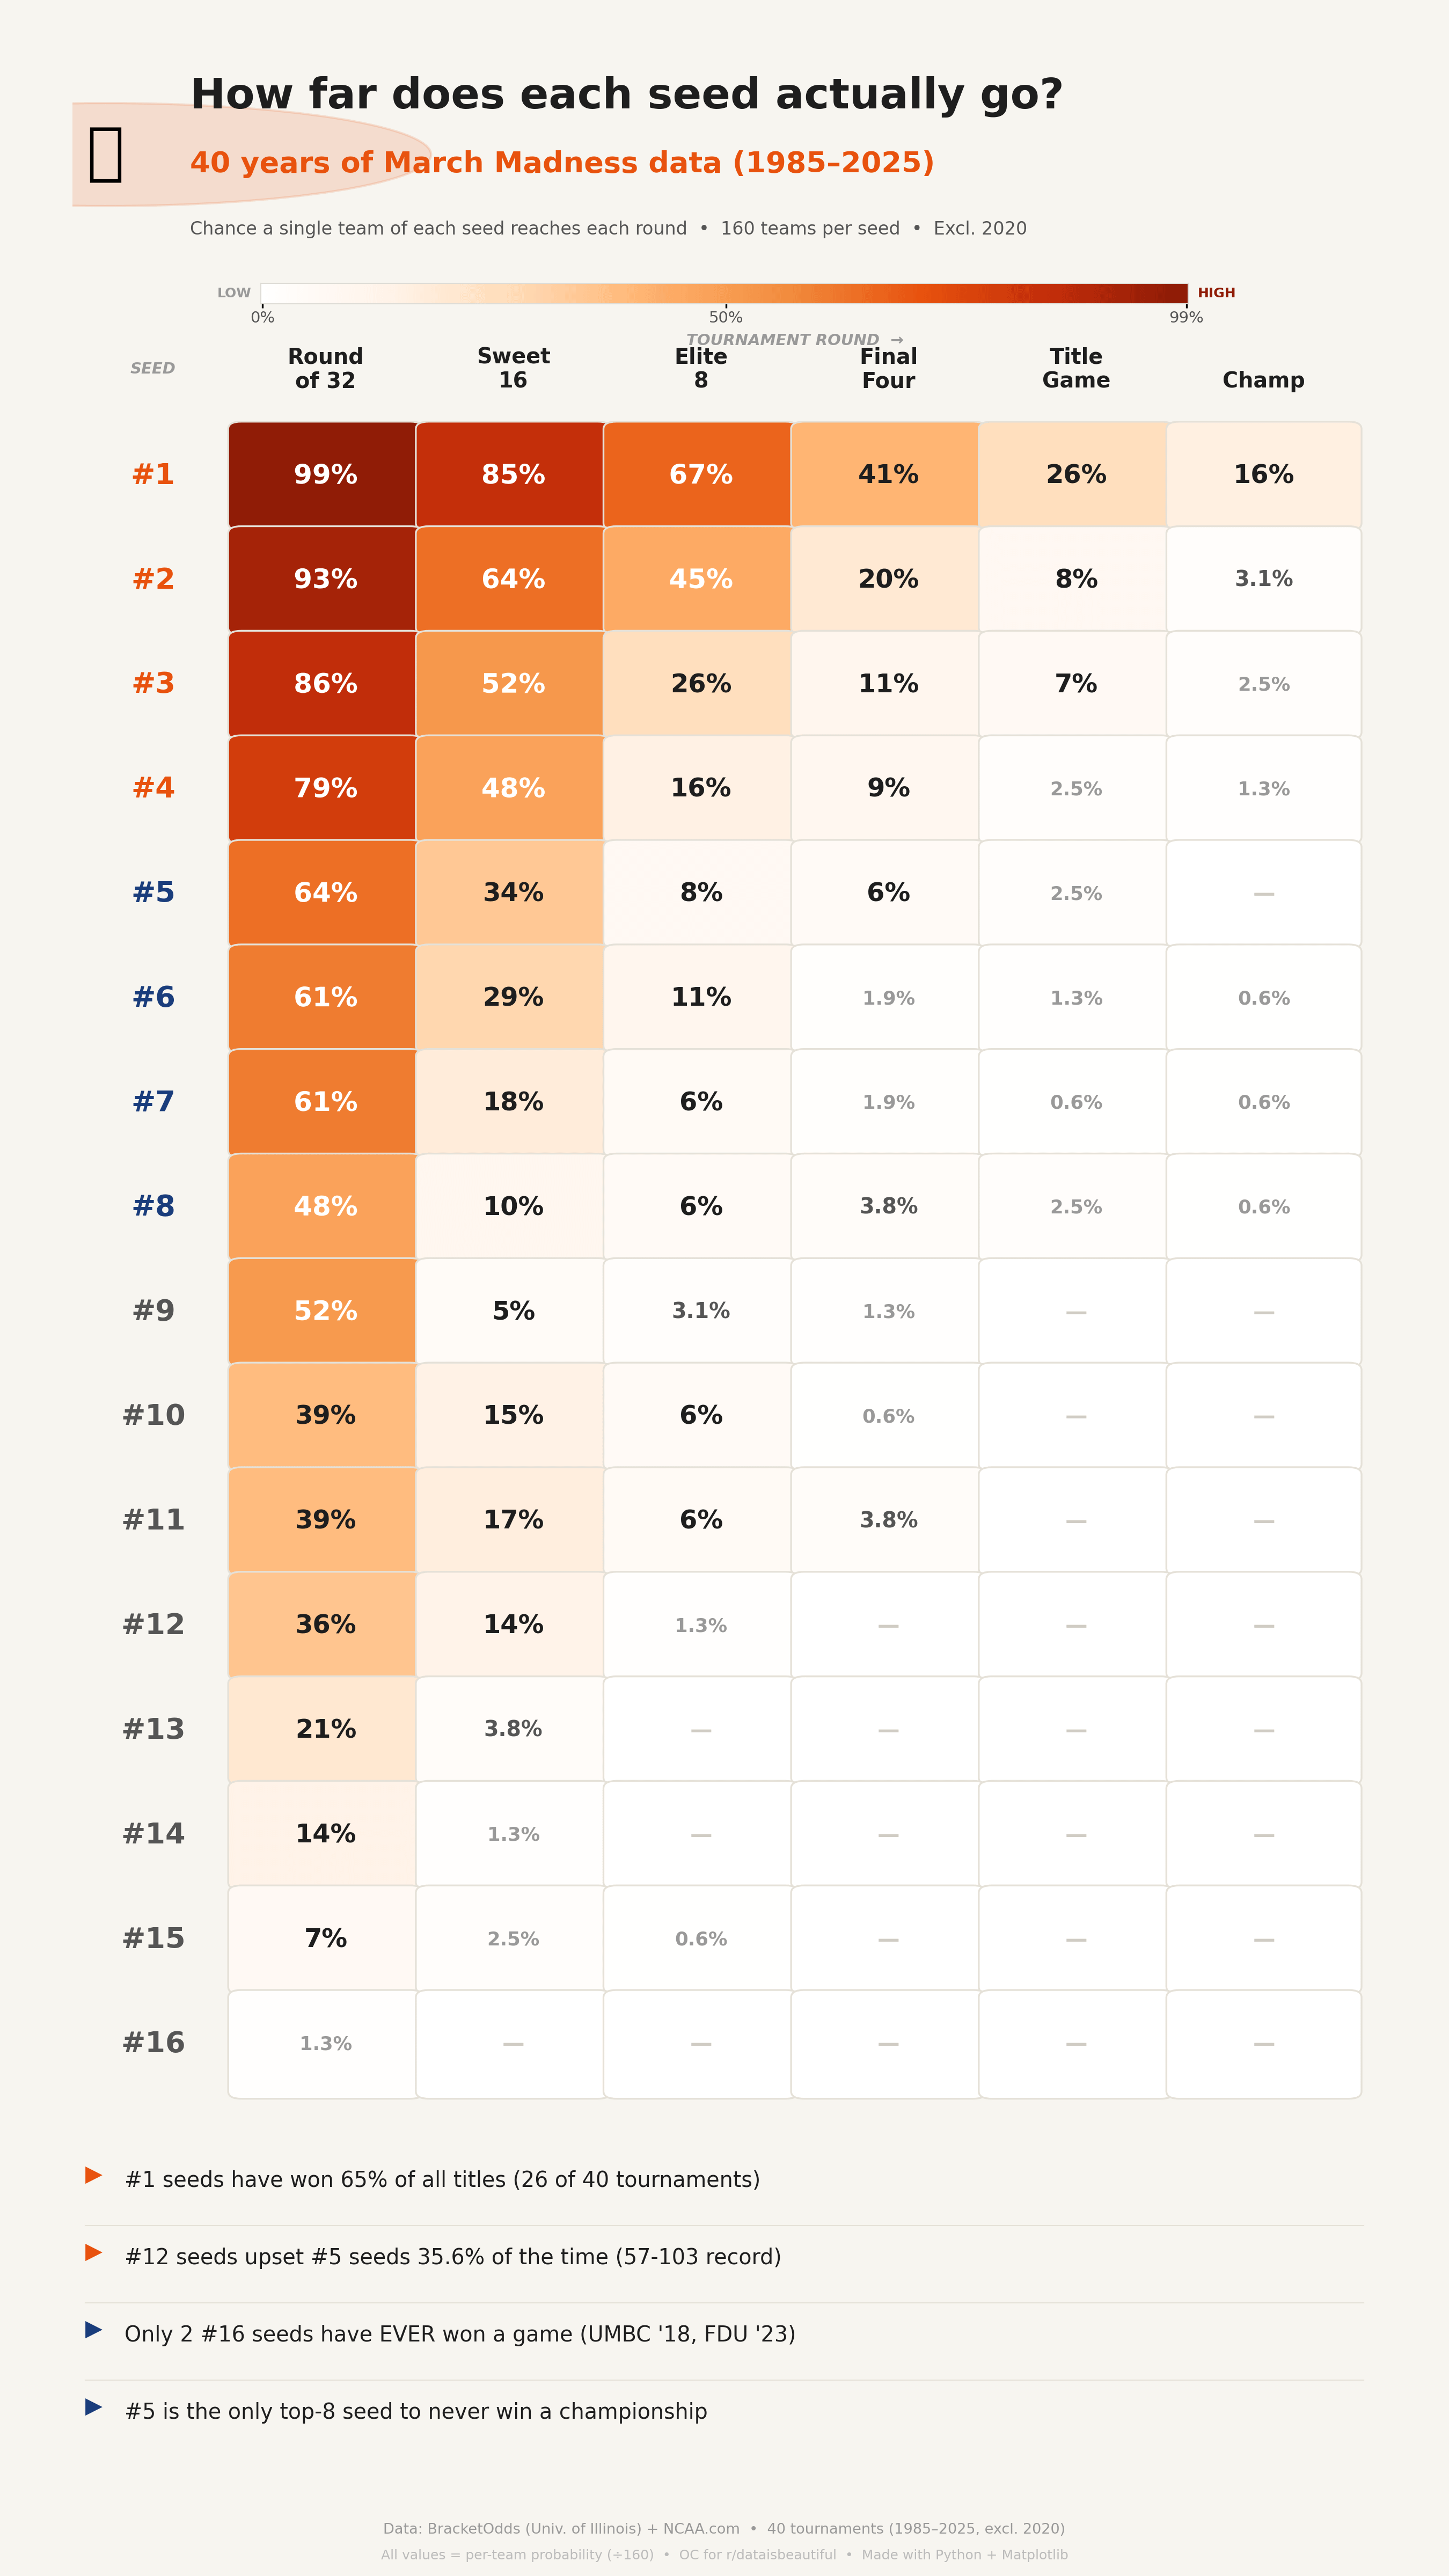
![[OC] I dug through 40 years of March Madness data so you don't have to. Here's how far each seed actually goes.](https://www.byteseu.com/wp-content/uploads/2026/03/yzikw7axfeqg1-864x1536.png "[OC] I dug through 40 years of March Madness data so you don’t have to. Here’s how far each seed actually goes.")
hey folks, I put this together while watching the games today. My bracket's already dead, so at least the data can live on.
Source: Historical seed advancement data compiled from BracketOdds (University of Illinois) and cross-checked against NCAA.com official seed records.
Method: 40 tournaments since the field expanded to 64 teams (1985–2025, no 2020). Every percentage = teams of that seed reaching that round ÷ 160 total teams. Consistent denominator across all rounds, so nothing is apples-to-oranges.
Tools: Python + Matplotlib in Google Colab.
Posted by the_h1b_records
11 Comments
Nicely done. I presume that the highest percentage possible in each column is 100%, except for the last two, where the brackets mix? E.g. there’s 4 # 1 seeds every year, but at most 1 can win the thing, so the max. pct. in the right-most column is 25%?
My favorite stat is that 9s beat 8s more often than not. And the only reason 5/12 feels special is because it’s closer to the 6/11 odds than the 4/13 odds.
11 makes the elite 8 more than 9 makes the sweet sixteen. I get that it’s because 9 faces 1 in round 2 but that’s still pretty wild. If I liked my teams chances to make a run I’d rather them get a 10 or 11 seed than an 8 or 9
Nice work putting this together! Who killed your bracket?
It would be interesting to see how this changes over time Based on changes to things like roster retention changes. Pre-transfers not having to sit out a year, the extra covid years, then the nil era. Although those all mix together don’t they….
11 seeds are the real Cinderellas, eights are much more dangerous than nines IF they make it past the first round. And fives are weird.
An 11 is often a team that is genuinely good but had a messy resume. Bad injury timing, underwhelming conference record, a strange profile, committee skepticism. A lot of 12 seeds are mature mid-major champions with continuity, shooting and a disciplined systems. Fives are probably weird in part because of that. Fives seeds are major conference teams that accumulated all the easy wins, but may be less coherent than their ranking.
Half the world sitting here thinking “It seems like OP is posting about sport, probably a USA specific sport, but I’m not sure which one”.
[The NCAA Tournament is a loser machine](https://youtu.be/4a1TUszkMfI?si=otV6Ds-0lbNQIfOL)
I’m not sure if I don’t understand the chart or American sport, but how can the #16 seed only reach top 32 1% of the time?
Isn’t it expected position #16? I’d expect it to have close to 50% chances of reaching the round of 16.
Would you be willing to share the raw dataset?
This is awesome! The exact numbers people need while making their brackets.
I made a video this year about “The Math Behind: March Madness” (https://youtu.be/CzKAJavOlgw?si=8Pvva2OWFCGJUPg2).
Do you mind if I use some of these numbers, or even the whole chart, in my 2027 video while citing you?
Keep up the amazing work!