
![[OC] 61% of American households can't afford to buy a home in their own neighborhood — local home affordability mapped by ZIP code](https://www.byteseu.com/wp-content/uploads/2026/03/j4j9c5k83bsg1-1024x589.png "[OC] 61% of American households can’t afford to buy a home in their own neighborhood — local home affordability mapped by ZIP code")
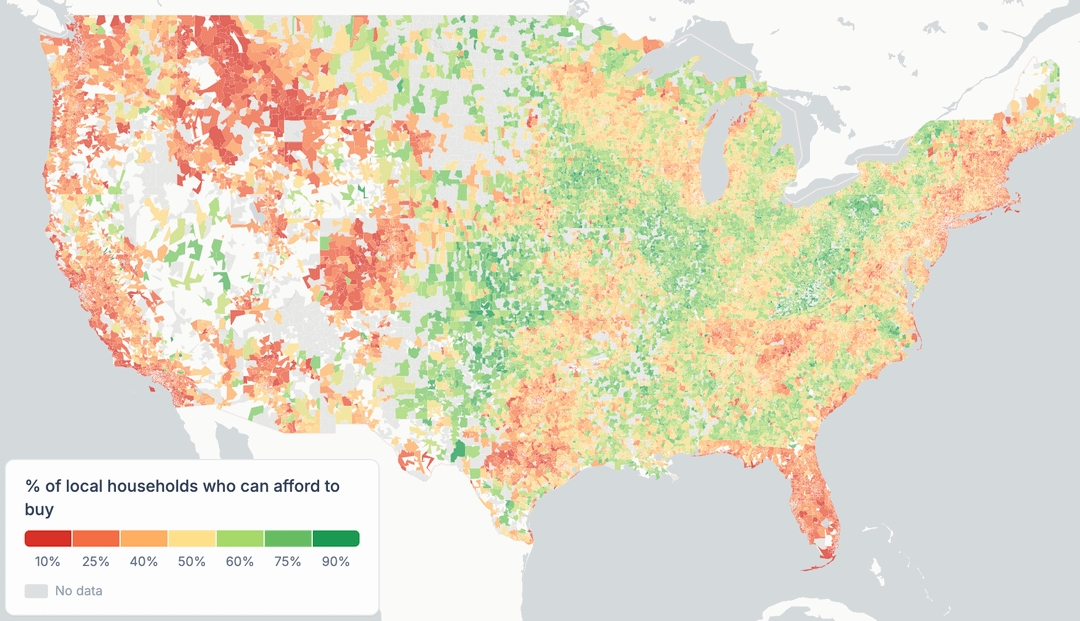
Sources: Zillow Home Value Index (typical home tier, 35th–65th percentile), Census ACS 5-year income distributions (16 brackets per ZIP), county property tax rates (Census ACS), state homeowners insurance averages (MoneyGeek).
Methodology: For each of 26,000 ZIP codes, I used the full Census income distribution, not a single median number, to estimate what percentage of local households
earn enough to buy a home in their own ZIP code without exceeding 33% of income on housing costs (the standard lender guideline). Housing costs include mortgage (6.5%,
30yr, 20% down), property tax, insurance, and 1% maintenance.
Key findings:
- 61% of U.S. households can't afford a typical home where they live
- Even for entry-level homes (5th–35th percentile), 45% are priced out
- This uses local household income, not the national median, so it reflects what people in each ZIP actually earn
Important note: This measures homeownership affordability only. It uses household income, not individual. "Affordable" = total monthly housing cost under 33% of
gross income.
A note on down payments: This map assumes 20% down with no PMI. The median first-time buyer actually puts down 9% (NAR). At 9% down with PMI, 67% of households can't afford a typical home and 51% can't afford even a starter home in their own neighborhood.
Tools: Python, Mapbox GL JS
Posted by Global-Thought-1049
2 Comments
How do you reconcile your findings with the fact that 65% of homes are owner occupied? And have been for 50 years. [https://fred.stlouisfed.org/series/RHORUSQ156N](https://fred.stlouisfed.org/series/RHORUSQ156N)
This is definitely a “fuck you if you’re color blind” scale.