
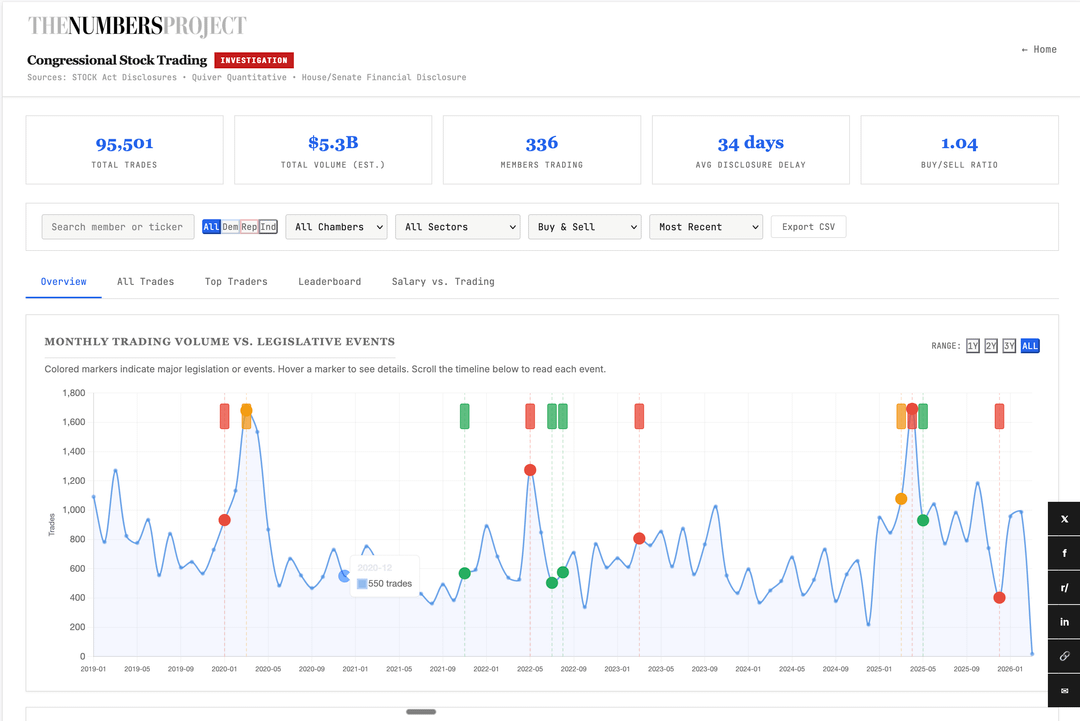
![[OC] Congressional stock trades, 2016–present: 95,501 trades, 336 members, searchable by name, party, state, and sector](https://www.byteseu.com/wp-content/uploads/2026/04/vbht15qv8xsg1-1024x684.png "[OC] Congressional stock trades, 2016–present: 95,501 trades, 336 members, searchable by name, party, state, and sector")
Not a journalist. Just a total data geek who has been coding for 20+ years and someone who went down a rabbit hole after realizing there was no single place a normal person could actually dig through this data themselves.
Took me months. 95,501 trades. 336 members. Cross-referenced against votes and committee assignments.
I was surprised to see the actual data but I'm sure it's been this was for decades:
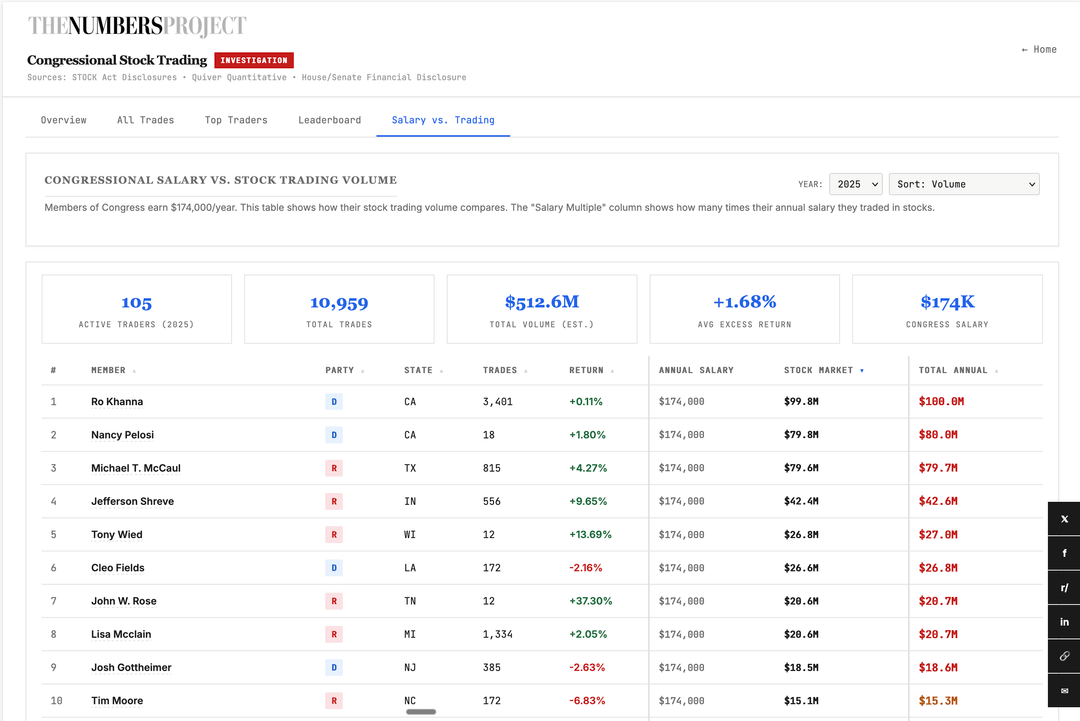
McCaul's trading volume is 7,266x his congressional salary. The salary we pay him. April 2, 2025 — Liberation Day, the tariff announcement — members logged 1,692 trades. Single day. All-time record in the dataset. The STOCK Act "ban" being floated right now has enough carve-outs that it would only cover maybe 15% of what's in here. I went through the actual text.
The most important part they conveniently left out of the announcement of the "ban":
"The bill doesn't cover adult children. It doesn't cover LLCs. It doesn't cover trusts. It doesn't cover the spouses' independently managed accounts that somehow make the same trades at the same time."
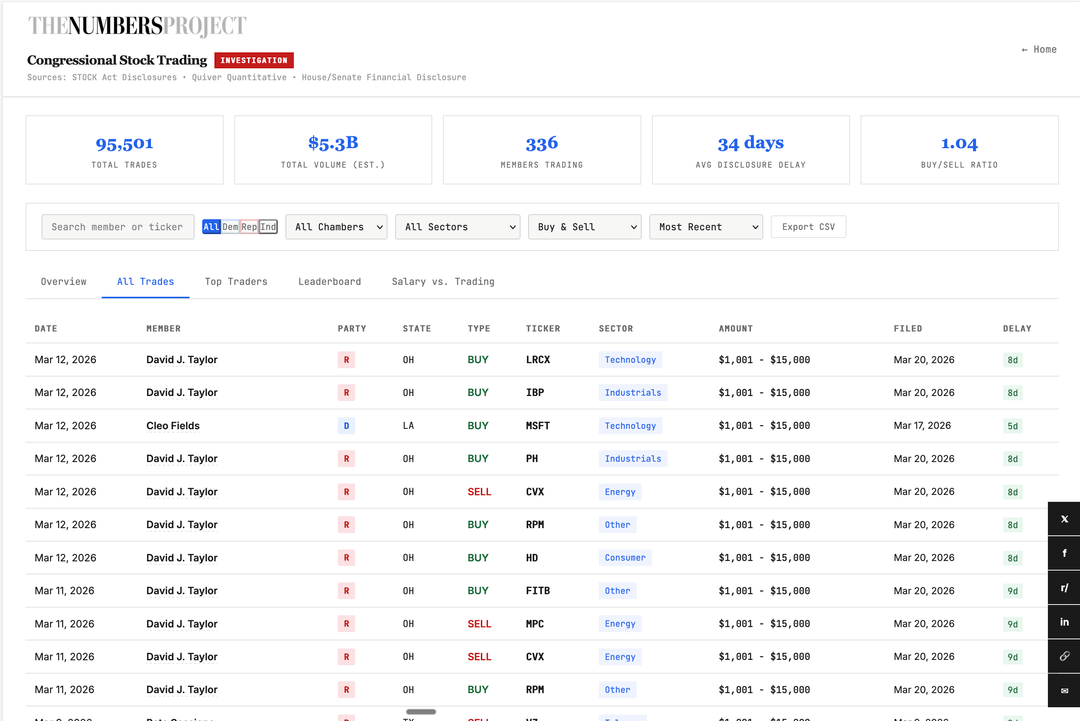
Searchable by member, party, state, and sector. Free, no login. Swipe through for different views. Happy to answer methodology questions in the comments.
Posted by Outrageous_Math6885
3 Comments
**[OC] Data sources + tools:**
Dashboard link: [thenumbersproject.org/tools/congress](http://thenumbersproject.org/tools/congress)
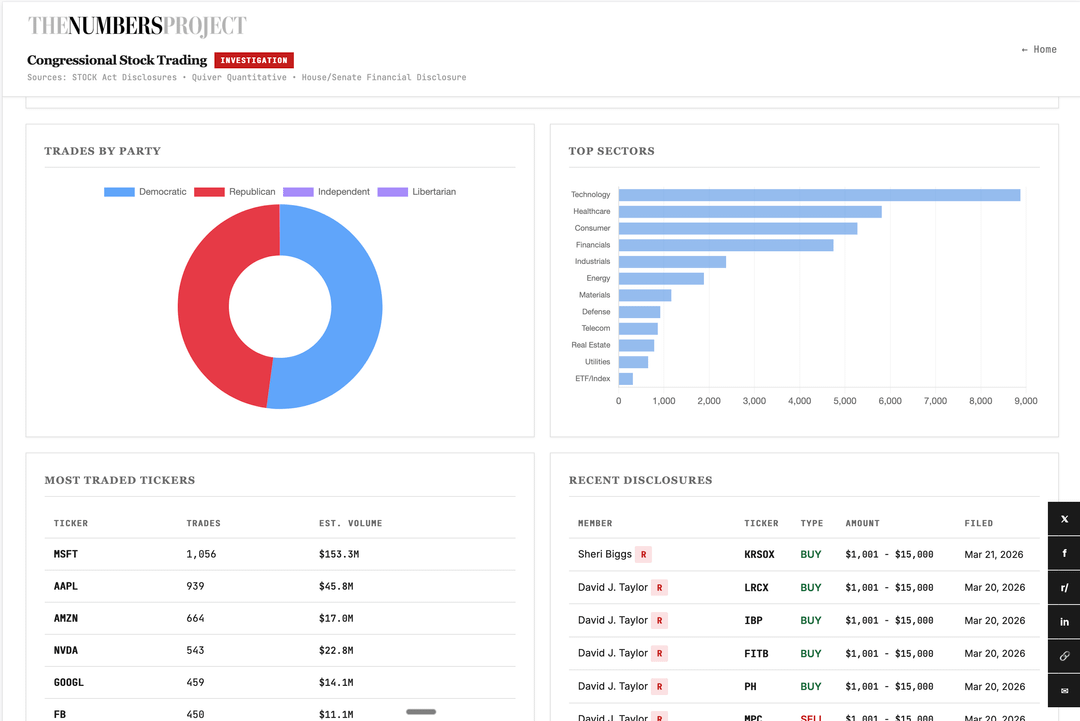
pulled from STOCK Act public disclosures 2016 through last week. Cross-referenced against congressional voting records and committee assignments. 4,436 correlations flagged. Built and maintained independently with no affiliation with any news org or financial platform. Also – please not the data is partisan. It’s clear both parties are equally taking adavantage of their positions.
Data
Im so glad corruption only happens in Africa, Latin America and parts of Asia
How many pages is the stock act? And did this have any effect on your stock choices