
![[OC] The Rise and Fall and Rise(?) of Toys “R” Us, Mapped (1957–2026)](https://www.byteseu.com/wp-content/uploads/2026/04/wnc1b67cbxsg1-1024x573.png "[OC] The Rise and Fall and Rise(?) of Toys “R” Us, Mapped (1957–2026)")
The dataset combines publicly available records, bankruptcy filings, historical store lists, and reconstructed estimates to capture the company’s footprint over time. Known store locations and closures (including detailed 2018 bankruptcy records) were used as anchor points, while missing locations were estimated using state-level store counts and population-weighted city data to maintain a realistic geographic distribution.
Where only partial dates were available, missing values were estimated to create a continuous timeline. The total number of stores at any given point follows known historical counts, ensuring the overall growth and decline aligns with real-world figures.
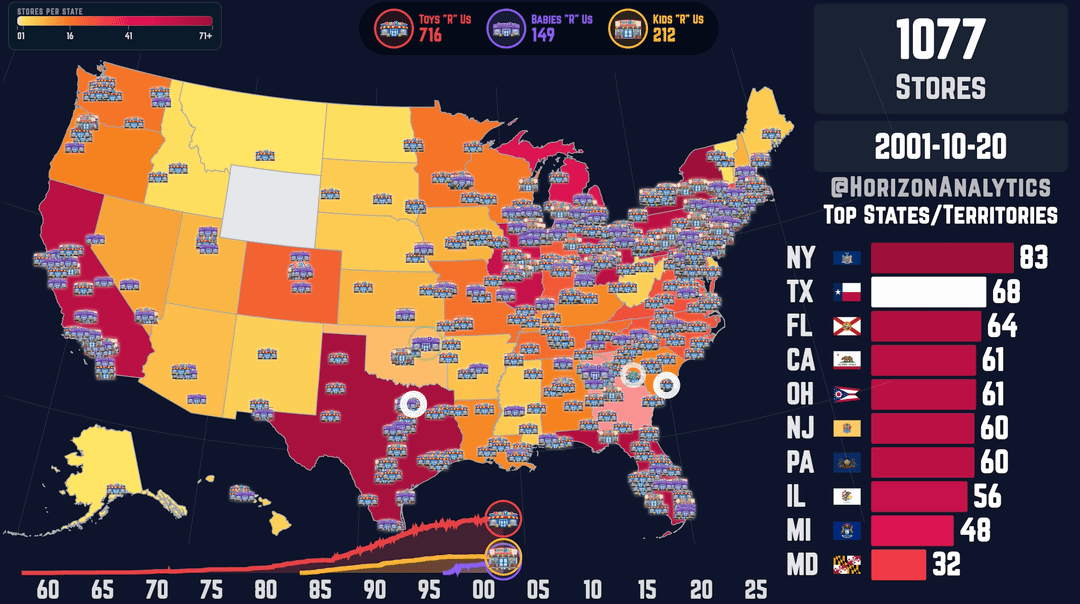
The animation shows each store appearing on the map as it opens, and disappearing as it closes. A live counter tracks the total number of active stores over time, while a racing bar chart highlights which states had the largest presence throughout each phase.
This visualization captures:
– Early growth from a small regional retailer
– Rapid nationwide expansion through the 1980s–2000s
– Peak dominance with over 1,000 stores
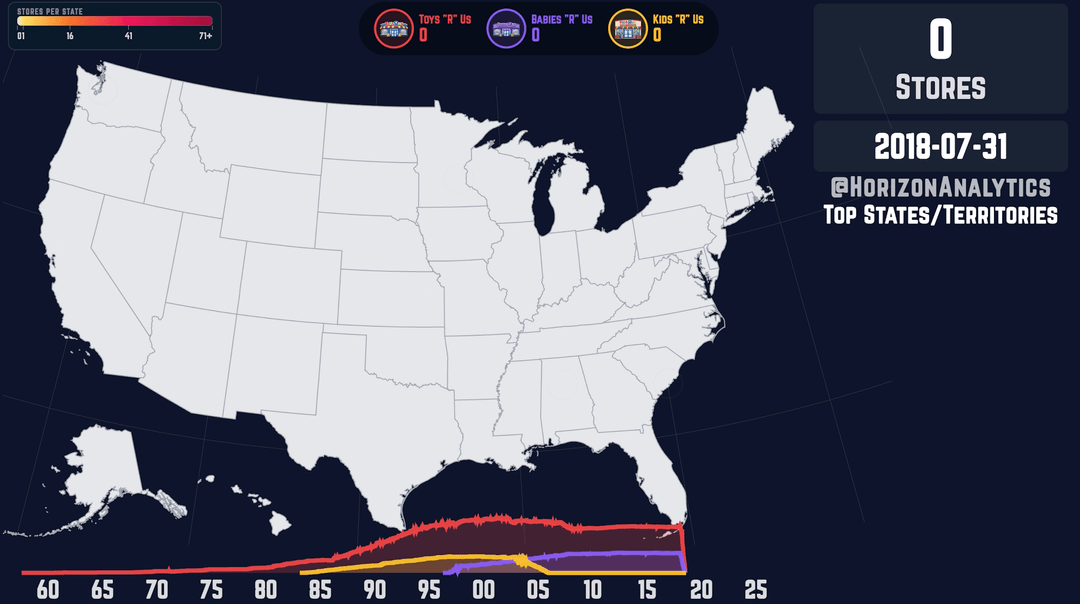
– The dramatic collapse during the 2017–2018 bankruptcy
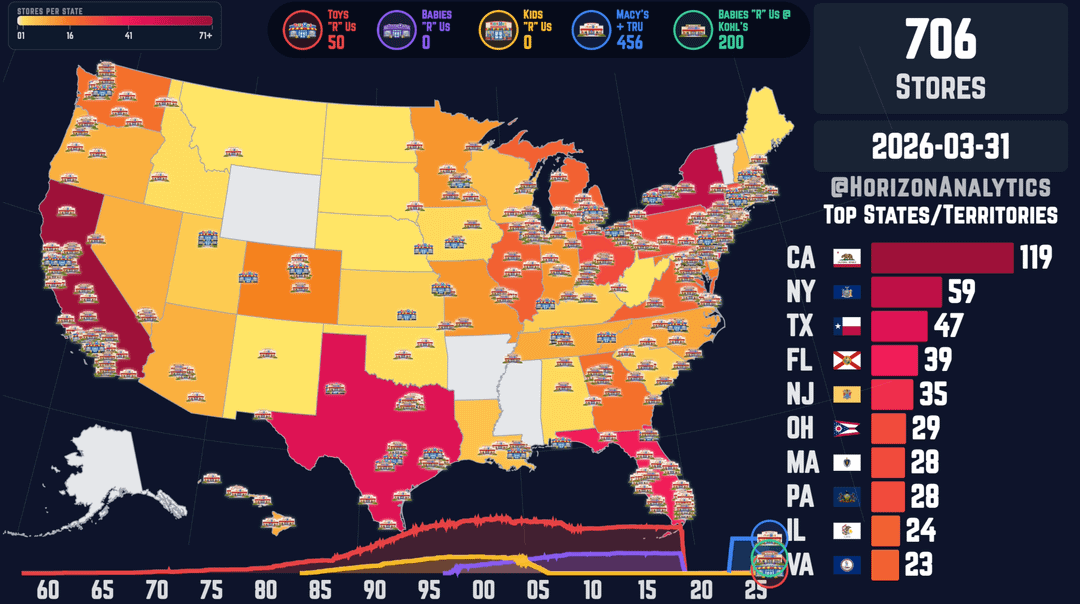
– And the modern revival through new formats, including Macy’s partnerships and Babies “R” – Us shop-in-shops in Kohl’s
Video link : https://www.youtube.com/watch?v=-KvVH6e0QJc
Posted by Horizon_Analytics
2 Comments
They’ll never get Wyoming
I worked there (in an Asian branch) in the early 2010s. I was hoping for a fun, kids-centric business. It was just a horror show of corporate leeches