To adjust the Canadian figures to American equivalents, I would use the PPP conversion factor given by the [World Bank](https://data.worldbank.org/indicator/PA.NUS.PPP), where 1 USD equals 1.15 CAD.
Thrillhousez on
BC doesn’t make sense to me. Expected them Alberta and Ontario to be the leaders. Then the maritimes especially Newfoundland to be lowest. Unless this is some strange metric that I’m not understanding. Like is this something like how much buying power a 100k income would have in each province?
sirduckbert on
I don’t know how people are doing it… my household income is 4x what’s there and we are fine but I definitely don’t feel very rich
Nyre88 on
Can someone explain these, please.
Southern_Station_643 on
A recent study has discovered that the cost of living now exceeds the benefit.
Competitive-Bit3388 on
Luckily I don’t have to be paid to live in BC. I’d never live anywhere else in Canada but BC, the best place on earth.
DJ_Mimosa on
Because OP couldn’t be bothered to put a lick of effort into explaining this in layman’s terms:
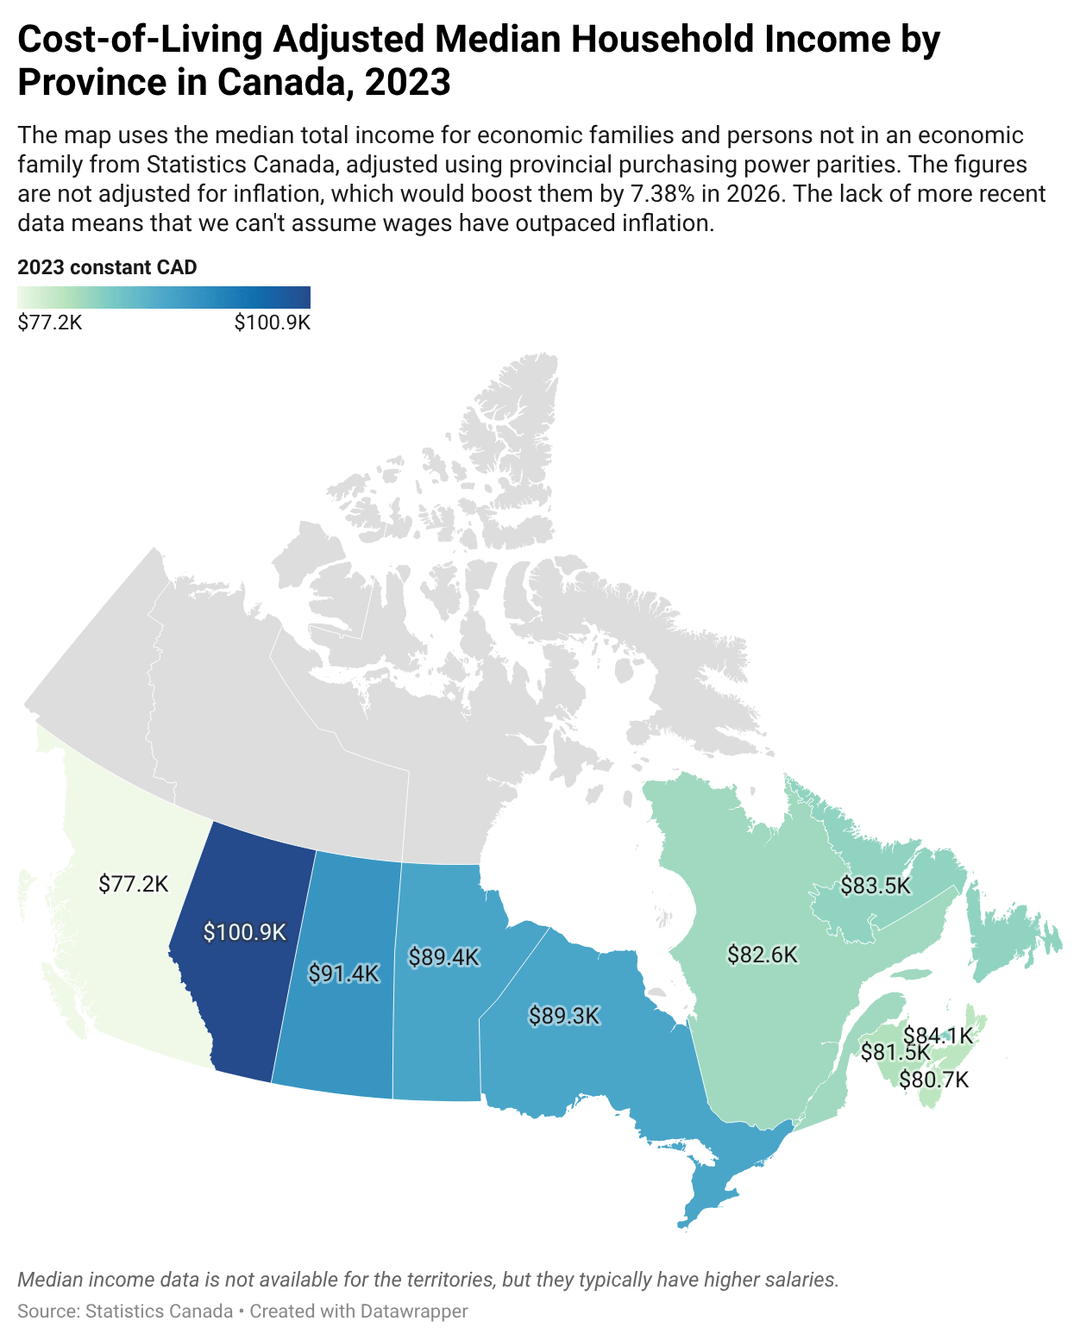
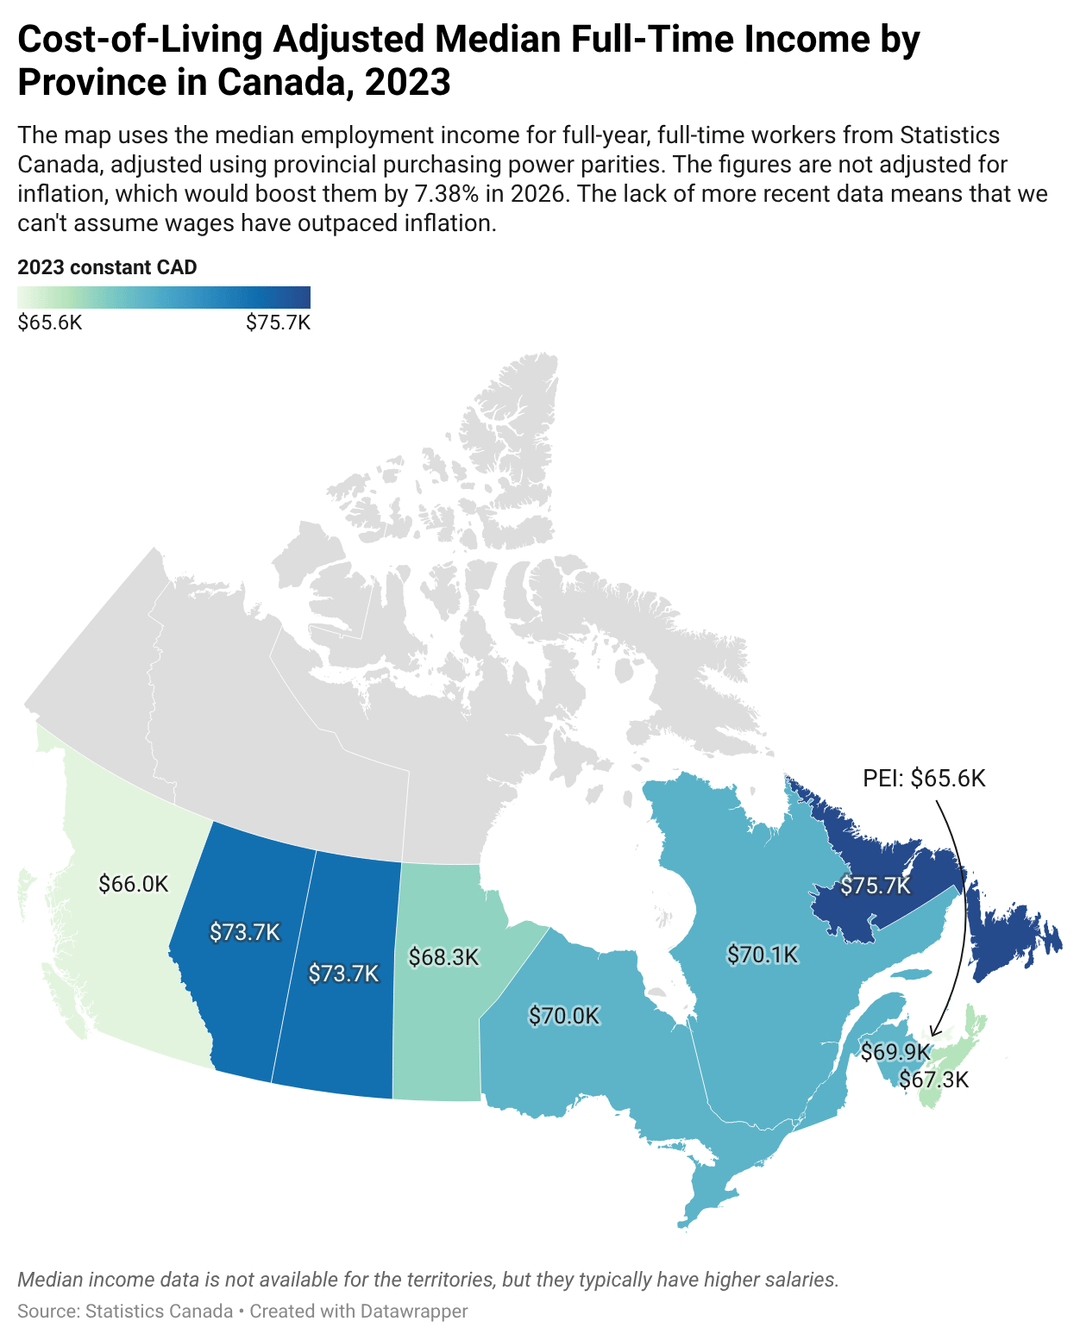
This map is basically how much you can buy, relative to how much you make. The higher number, the better.
saveoursoil on
you need to do the lower portion. the area of the province is distorting everything, especially BC
BrilliantFuture891 on
This is interesting, but I’d like to see it broken down into CMAs, though that breakdown will mostly come down to housing costs. It’s well known that, for example, Greater Toronto Area economy is different from the rest of Ontario.
dsetoya on
This graph states that the lack of more recent data suggests that we cannot assume wages have outpaced inflation, yet Carney claims that wages are outpacing inflation. Is he correct or BS’ing??
Ok_Passage7713 on
Is it that bad in Alberta?? I was debating on moving there (from Ontario) in the future.
whk1992 on
Let’s plot a chart for “purchasing power in Alberta.” I think BC might win.
NoDoze- on
This is such a poor graphic. All the comments are of people trying to understand it. LOL
jay370gt on
Ok so according to this, Quebec seems to be doing better than BC, so why does Quebec get so much in equalization payment while BC gets none?
RK5000 on
I read some of the comments below and I think I understand what these documents convey.

![[OC] Cost-of-Living Adjusted Median Income by Province in Canada, 2023](https://www.byteseu.com/wp-content/uploads/2026/04/m5kuhzlefgtg1-825x1024.png "[OC] Cost-of-Living Adjusted Median Income by Province in Canada, 2023")
15 Comments
Links to Statistics Canada data: [Full-time income](https://www150.statcan.gc.ca/t1/tbl1/en/tv.action?pid=1110024001&pickMembers%5B0%5D=1.1&pickMembers%5B1%5D=2.1&pickMembers%5B2%5D=3.2&cubeTimeFrame.startYear=2023&cubeTimeFrame.endYear=2023&referencePeriods=20230101%2C20230101), [Household income](https://www150.statcan.gc.ca/t1/tbl1/en/tv.action?pid=1110019001&pickMembers%5B0%5D=1.1&cubeTimeFrame.startYear=2023&cubeTimeFrame.endYear=2023&referencePeriods=20230101%2C20230101).
Purchasing power parities for different provinces (table 3), which I used to divided median incomes by: [https://www150.statcan.gc.ca/n1/pub/11-633-x/11-633-x2025003-eng.htm](https://www150.statcan.gc.ca/n1/pub/11-633-x/11-633-x2025003-eng.htm)
These maps follow the same format as the post for the US: [https://www.reddit.com/r/dataisbeautiful/comments/1nemaep/oc_costofliving_adjusted_median_household_income/](https://www.reddit.com/r/dataisbeautiful/comments/1nemaep/oc_costofliving_adjusted_median_household_income/)
To adjust the Canadian figures to American equivalents, I would use the PPP conversion factor given by the [World Bank](https://data.worldbank.org/indicator/PA.NUS.PPP), where 1 USD equals 1.15 CAD.
BC doesn’t make sense to me. Expected them Alberta and Ontario to be the leaders. Then the maritimes especially Newfoundland to be lowest. Unless this is some strange metric that I’m not understanding. Like is this something like how much buying power a 100k income would have in each province?
I don’t know how people are doing it… my household income is 4x what’s there and we are fine but I definitely don’t feel very rich
Can someone explain these, please.
A recent study has discovered that the cost of living now exceeds the benefit.
Luckily I don’t have to be paid to live in BC. I’d never live anywhere else in Canada but BC, the best place on earth.
Because OP couldn’t be bothered to put a lick of effort into explaining this in layman’s terms:
This map is basically how much you can buy, relative to how much you make. The higher number, the better.
you need to do the lower portion. the area of the province is distorting everything, especially BC
This is interesting, but I’d like to see it broken down into CMAs, though that breakdown will mostly come down to housing costs. It’s well known that, for example, Greater Toronto Area economy is different from the rest of Ontario.
This graph states that the lack of more recent data suggests that we cannot assume wages have outpaced inflation, yet Carney claims that wages are outpacing inflation. Is he correct or BS’ing??
Is it that bad in Alberta?? I was debating on moving there (from Ontario) in the future.
Let’s plot a chart for “purchasing power in Alberta.” I think BC might win.
This is such a poor graphic. All the comments are of people trying to understand it. LOL
Ok so according to this, Quebec seems to be doing better than BC, so why does Quebec get so much in equalization payment while BC gets none?
I read some of the comments below and I think I understand what these documents convey.