cavedave on April 8, 2026 10:59 am Data from [https://github.com/GMU-CherryBlossomCompetition/peak-bloom-prediction/tree/main/data](https://github.com/GMU-CherryBlossomCompetition/peak-bloom-prediction/tree/main/data) R package ggplot2 code i can put on github if anyone wants it. It is similar to this version i made ages ago [https://www.reddit.com/r/dataisbeautiful/comments/8jcuvg/when_cherry_blossoms_appear_in_kyoto_oc/](https://www.reddit.com/r/dataisbeautiful/comments/8jcuvg/when_cherry_blossoms_appear_in_kyoto_oc/)
atape_1 on April 8, 2026 11:02 am Arguably the most important time series we have ever measured. Would be nice if you included an error ribbon.
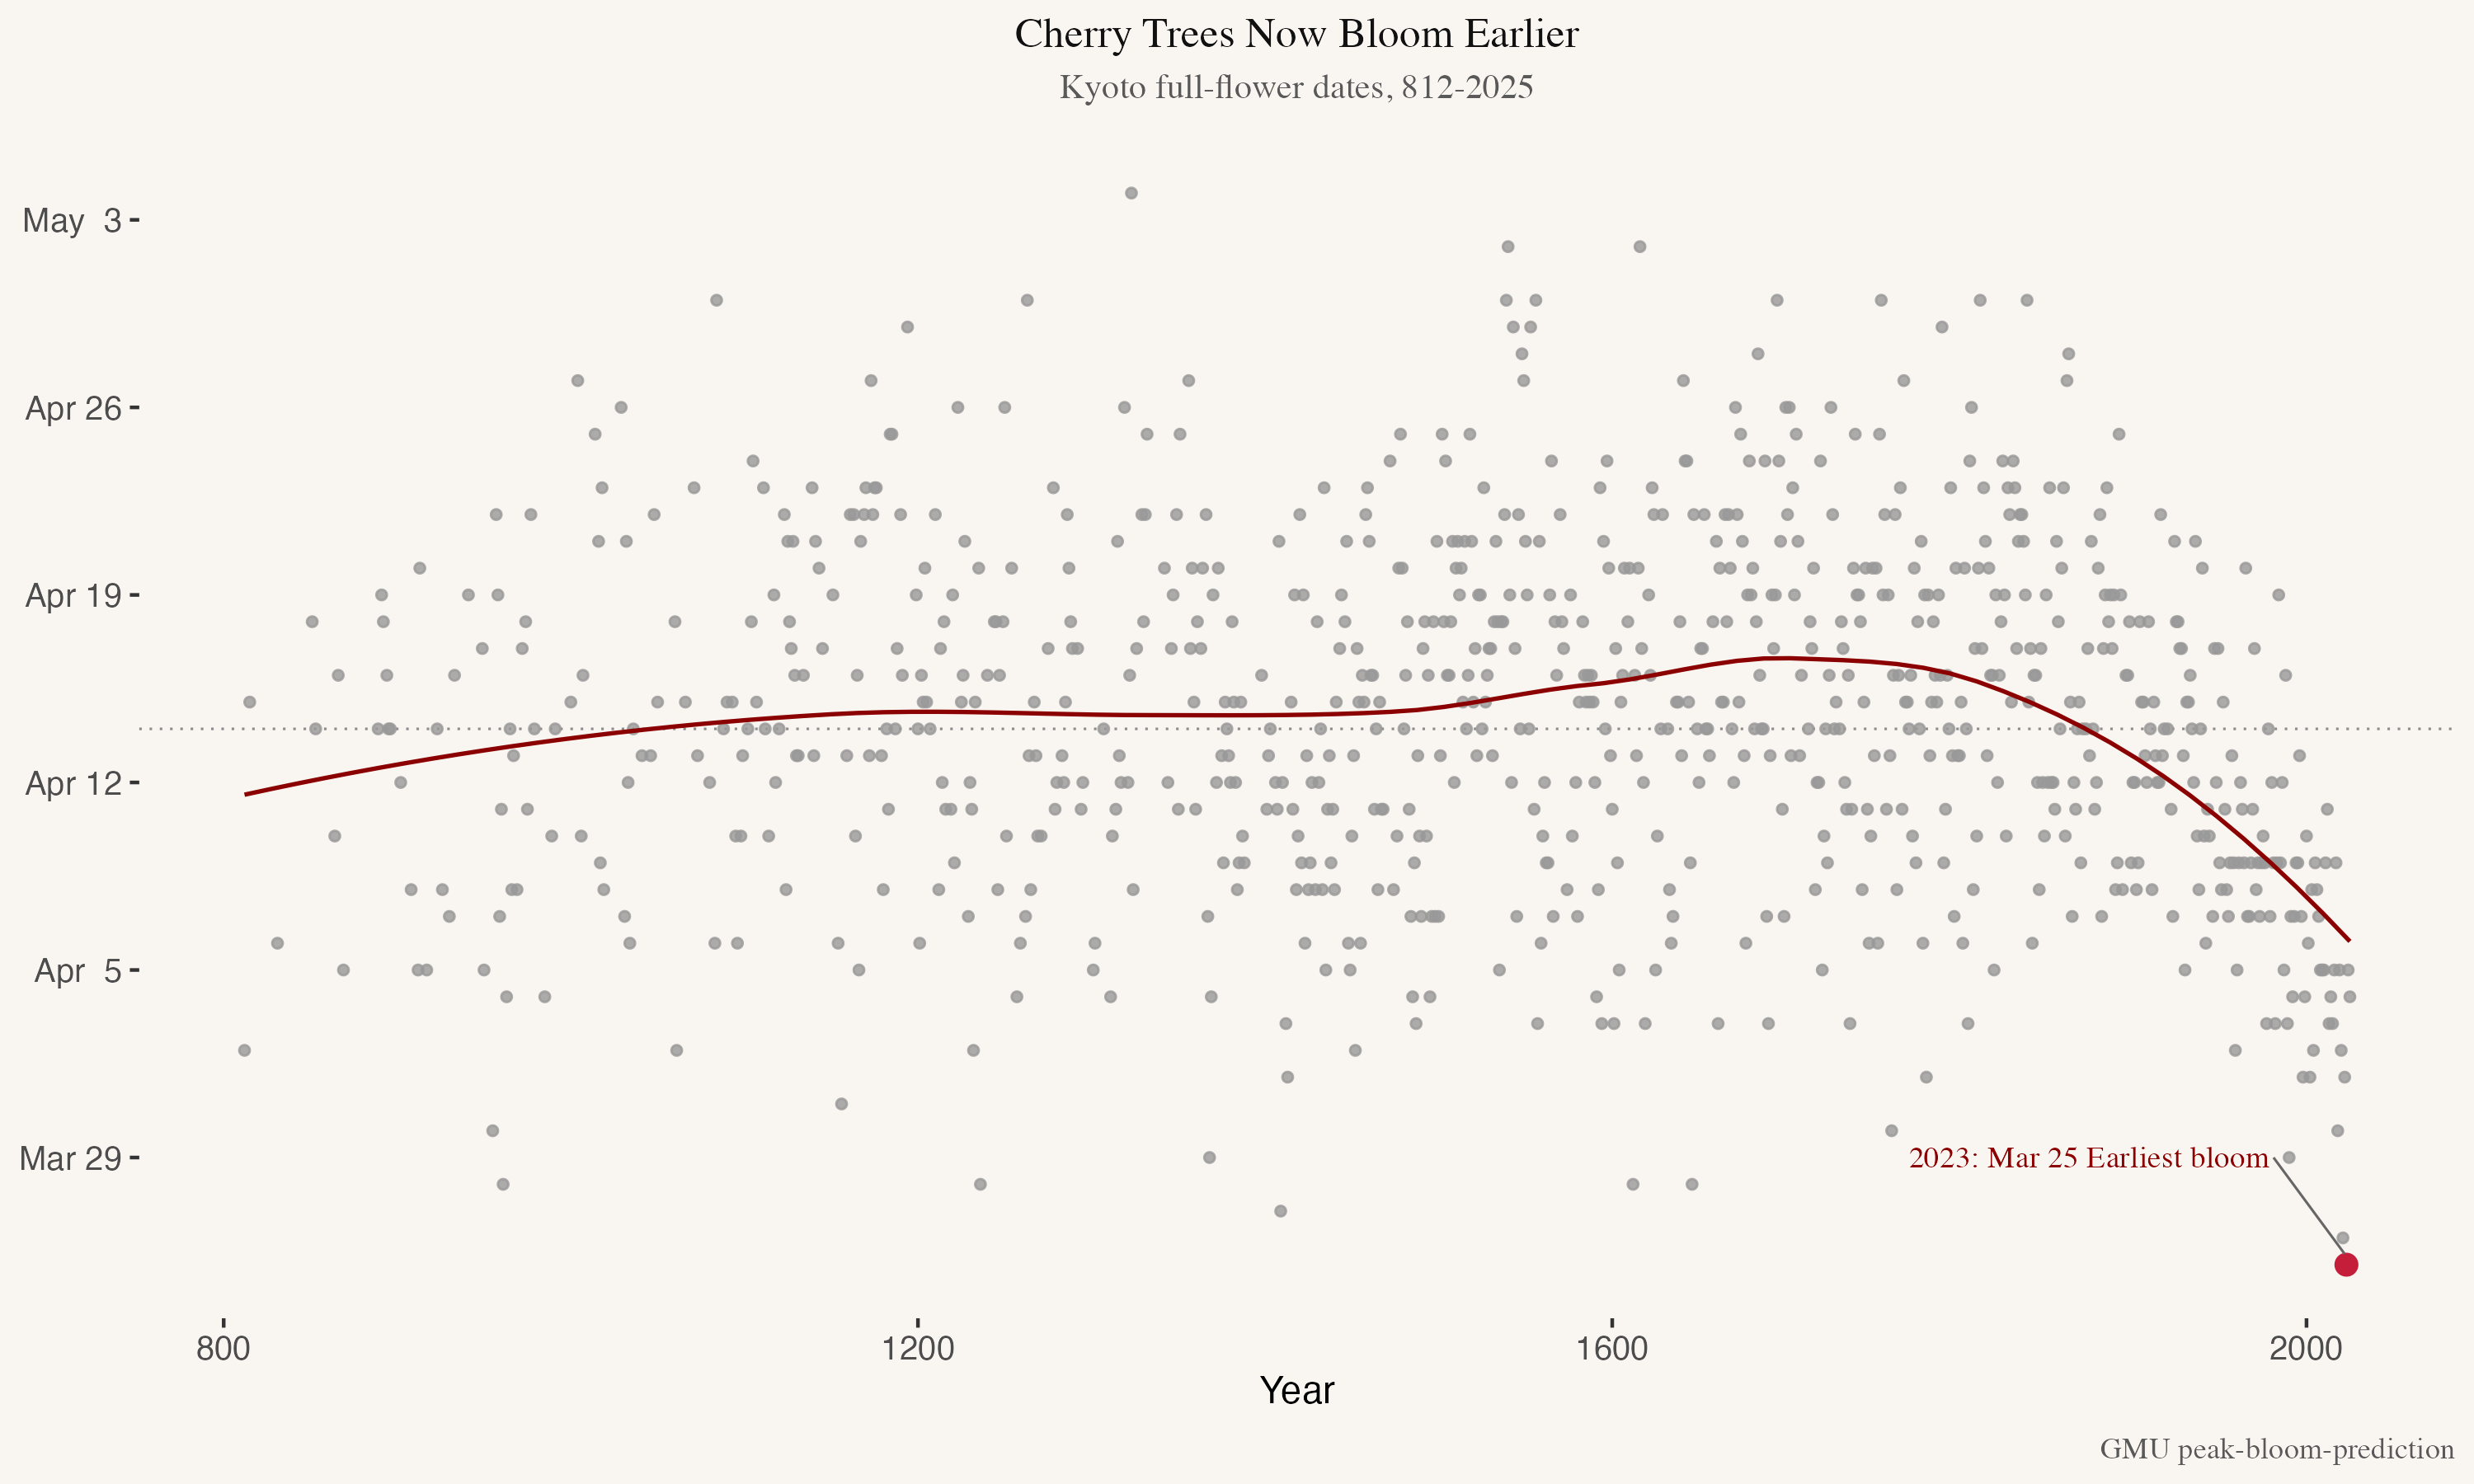
throwawaycanadian2 on April 8, 2026 2:53 pm Some error bars are desperately needed here – that line is doing a TON of heavy lifting, especially given the scale of the chart is quite small.

![Kyoto Cherry Trees now Bloom Earlier [OC]](https://www.byteseu.com/wp-content/uploads/2026/04/w0xcjjzv6ytg1-1536x922.png "Kyoto Cherry Trees now Bloom Earlier [OC]")
6 Comments
Data from [https://github.com/GMU-CherryBlossomCompetition/peak-bloom-prediction/tree/main/data](https://github.com/GMU-CherryBlossomCompetition/peak-bloom-prediction/tree/main/data)
R package ggplot2 code i can put on github if anyone wants it. It is similar to this version i made ages ago [https://www.reddit.com/r/dataisbeautiful/comments/8jcuvg/when_cherry_blossoms_appear_in_kyoto_oc/](https://www.reddit.com/r/dataisbeautiful/comments/8jcuvg/when_cherry_blossoms_appear_in_kyoto_oc/)
Arguably the most important time series we have ever measured.
Would be nice if you included an error ribbon.
DC had peak bloom on the 26th.
Some error bars are desperately needed here – that line is doing a TON of heavy lifting, especially given the scale of the chart is quite small.
Ya couldn’t have waited a few more days for the 2026 data?
They have data from the 9th century? Jesus…