
![[OC] Music frequency spectrum particle visualizer](https://www.byteseu.com/wp-content/uploads/2026/04/a7etwrbql7vg1-768x1024.jpg "[OC] Music frequency spectrum particle visualizer")
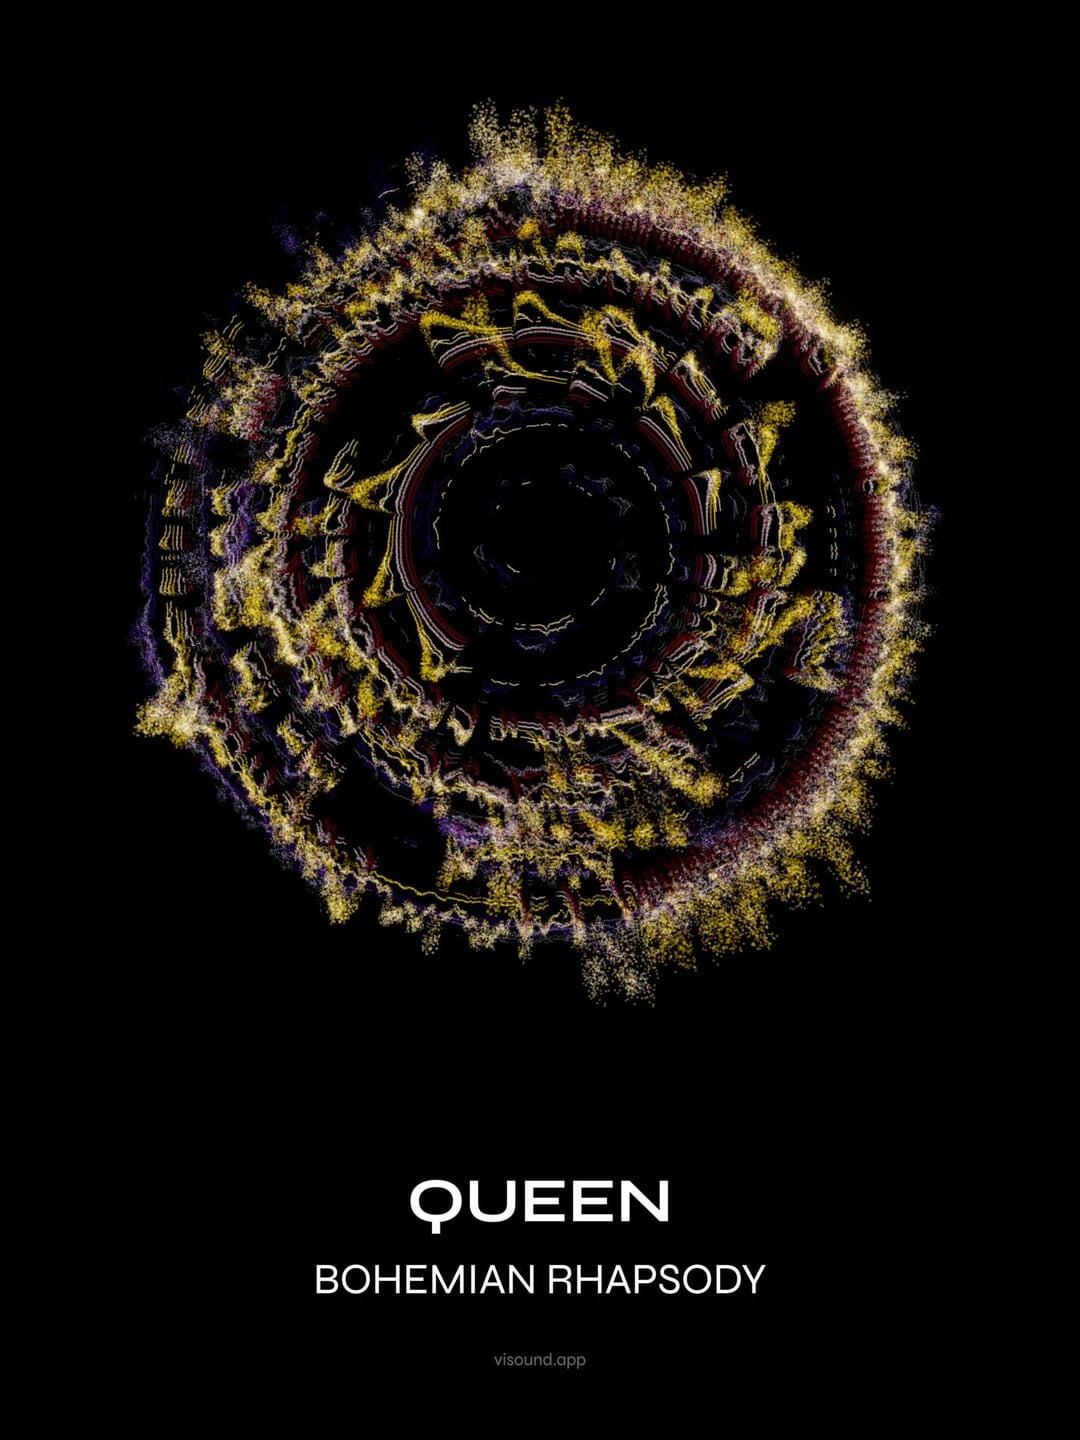
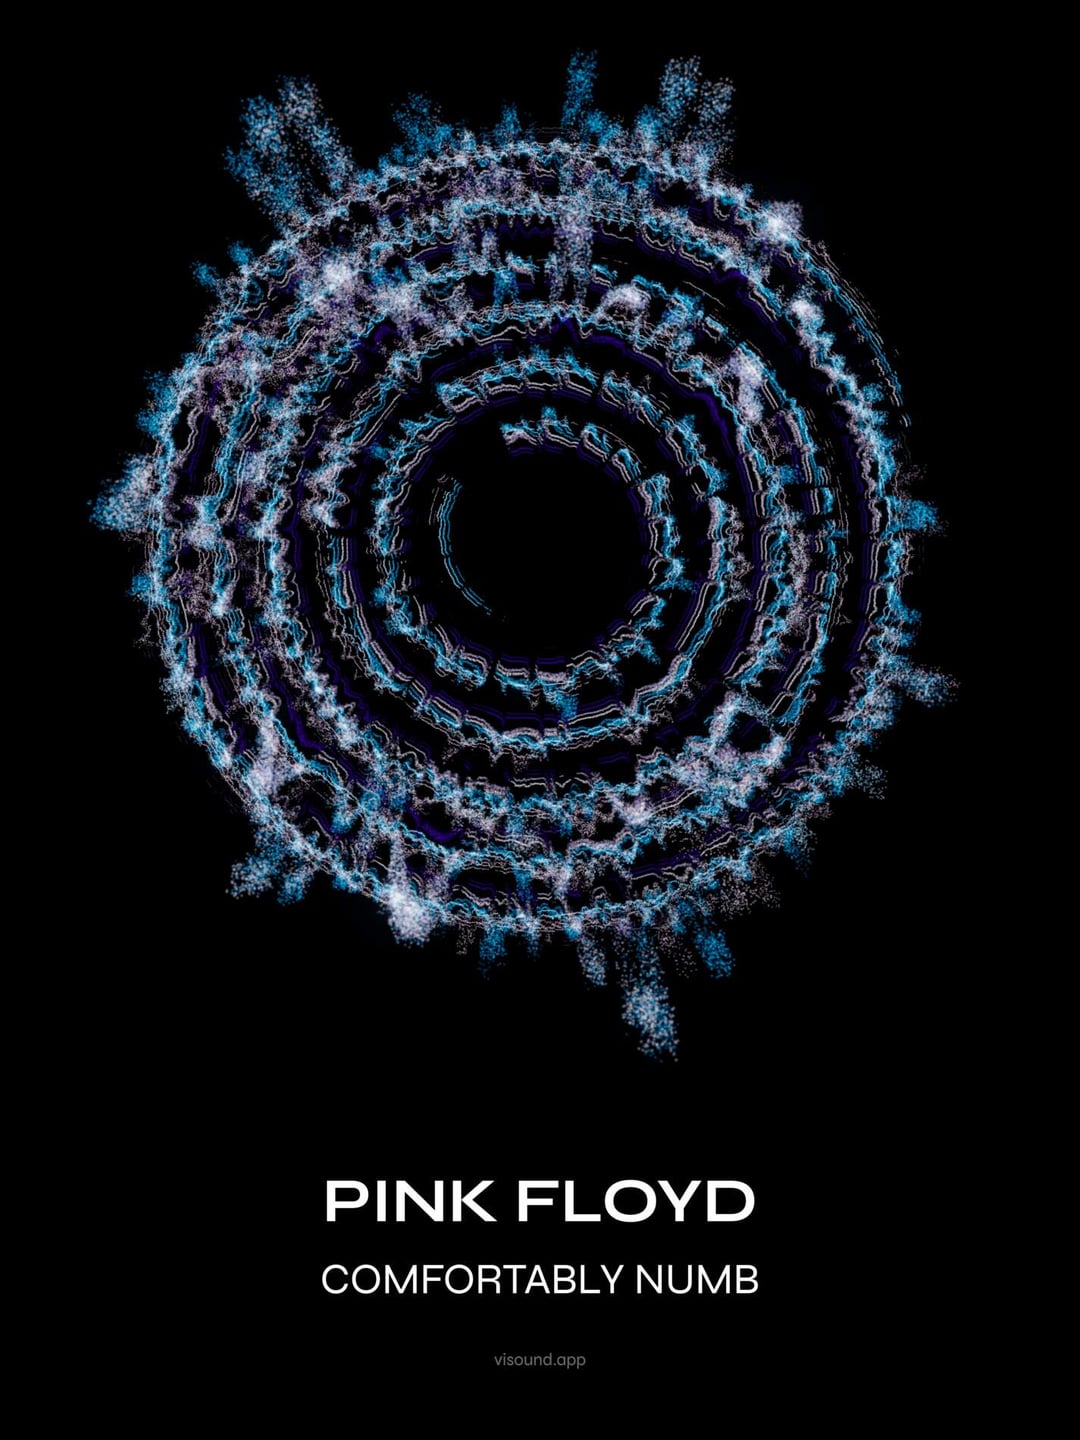
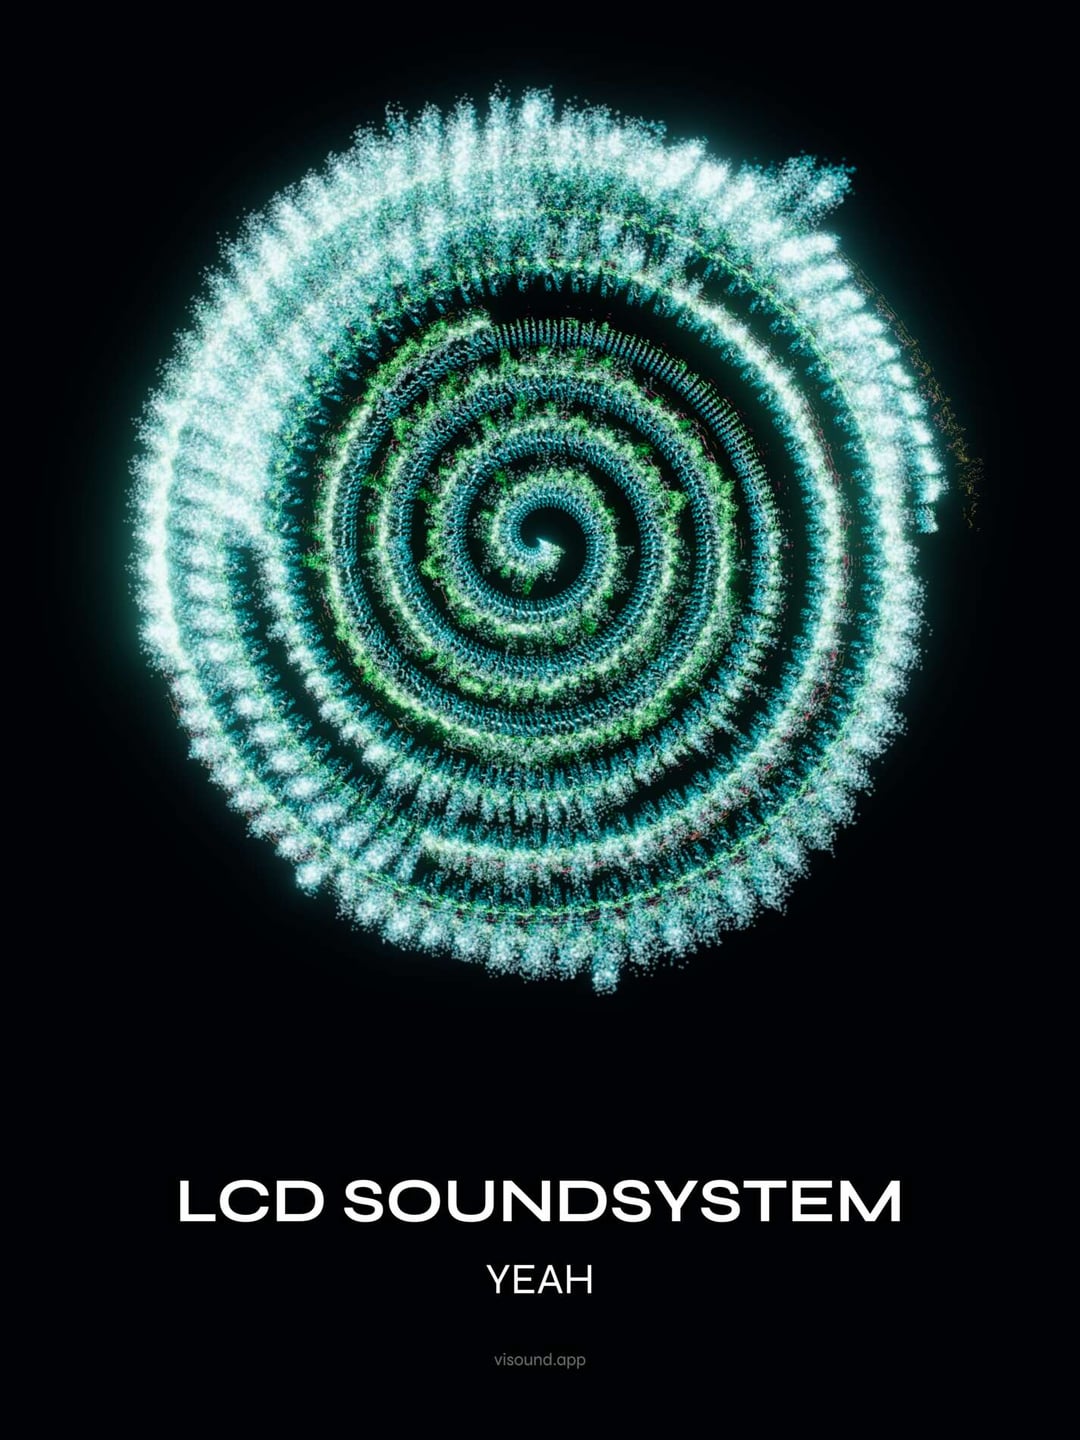
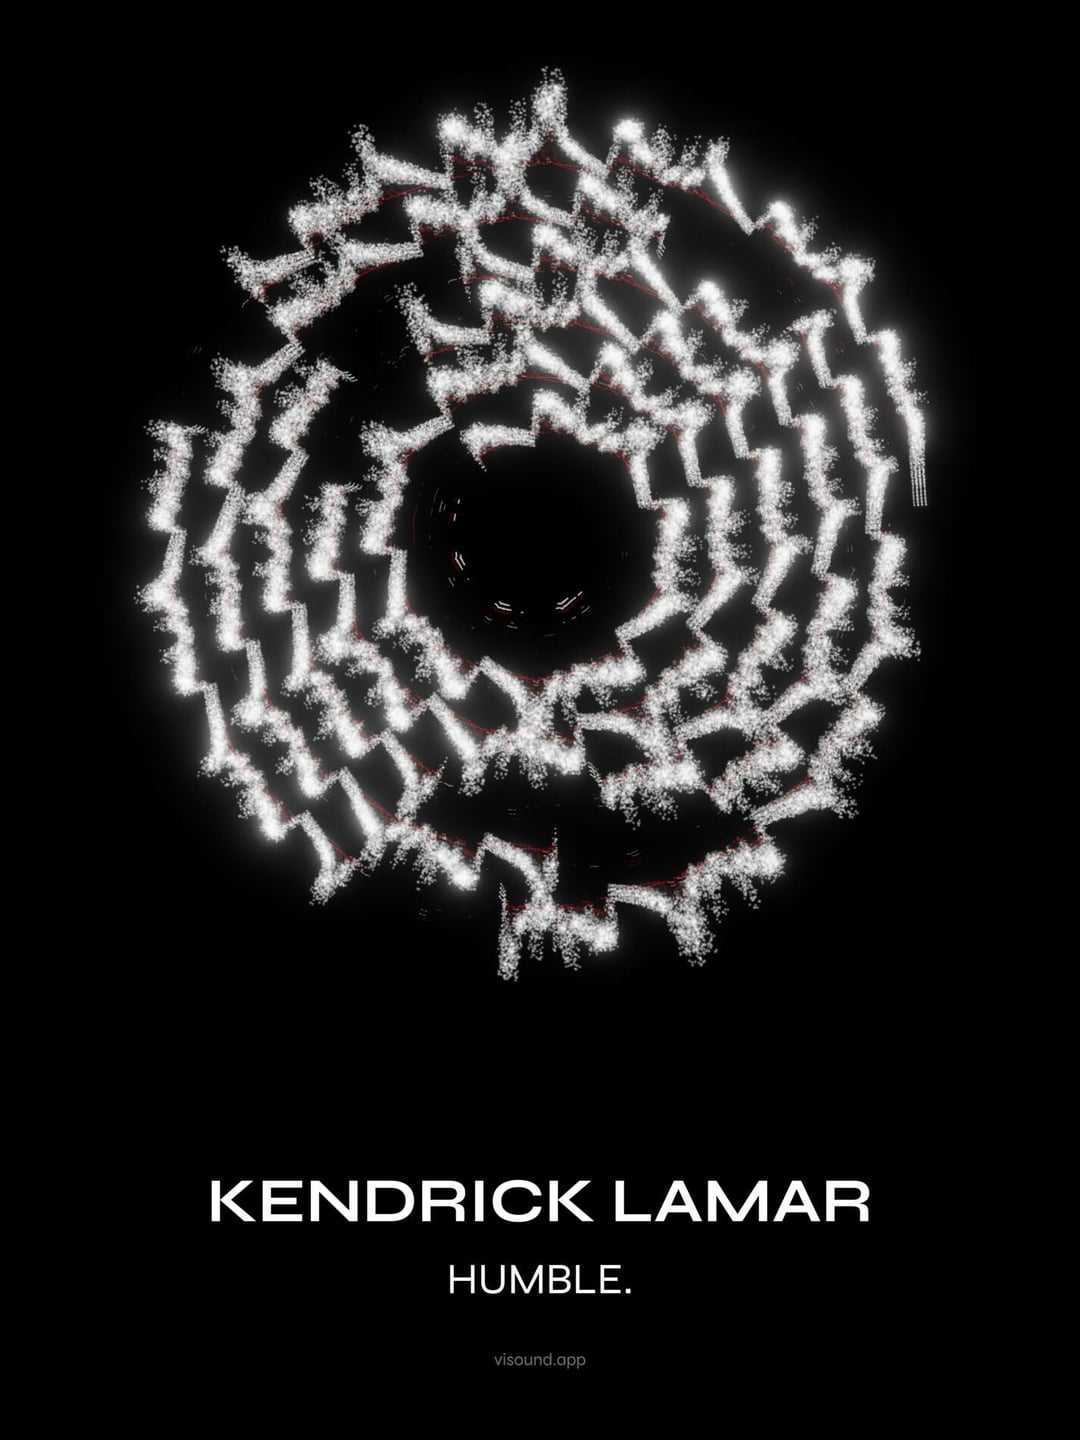
So I've been working on this visualizer for a while now.
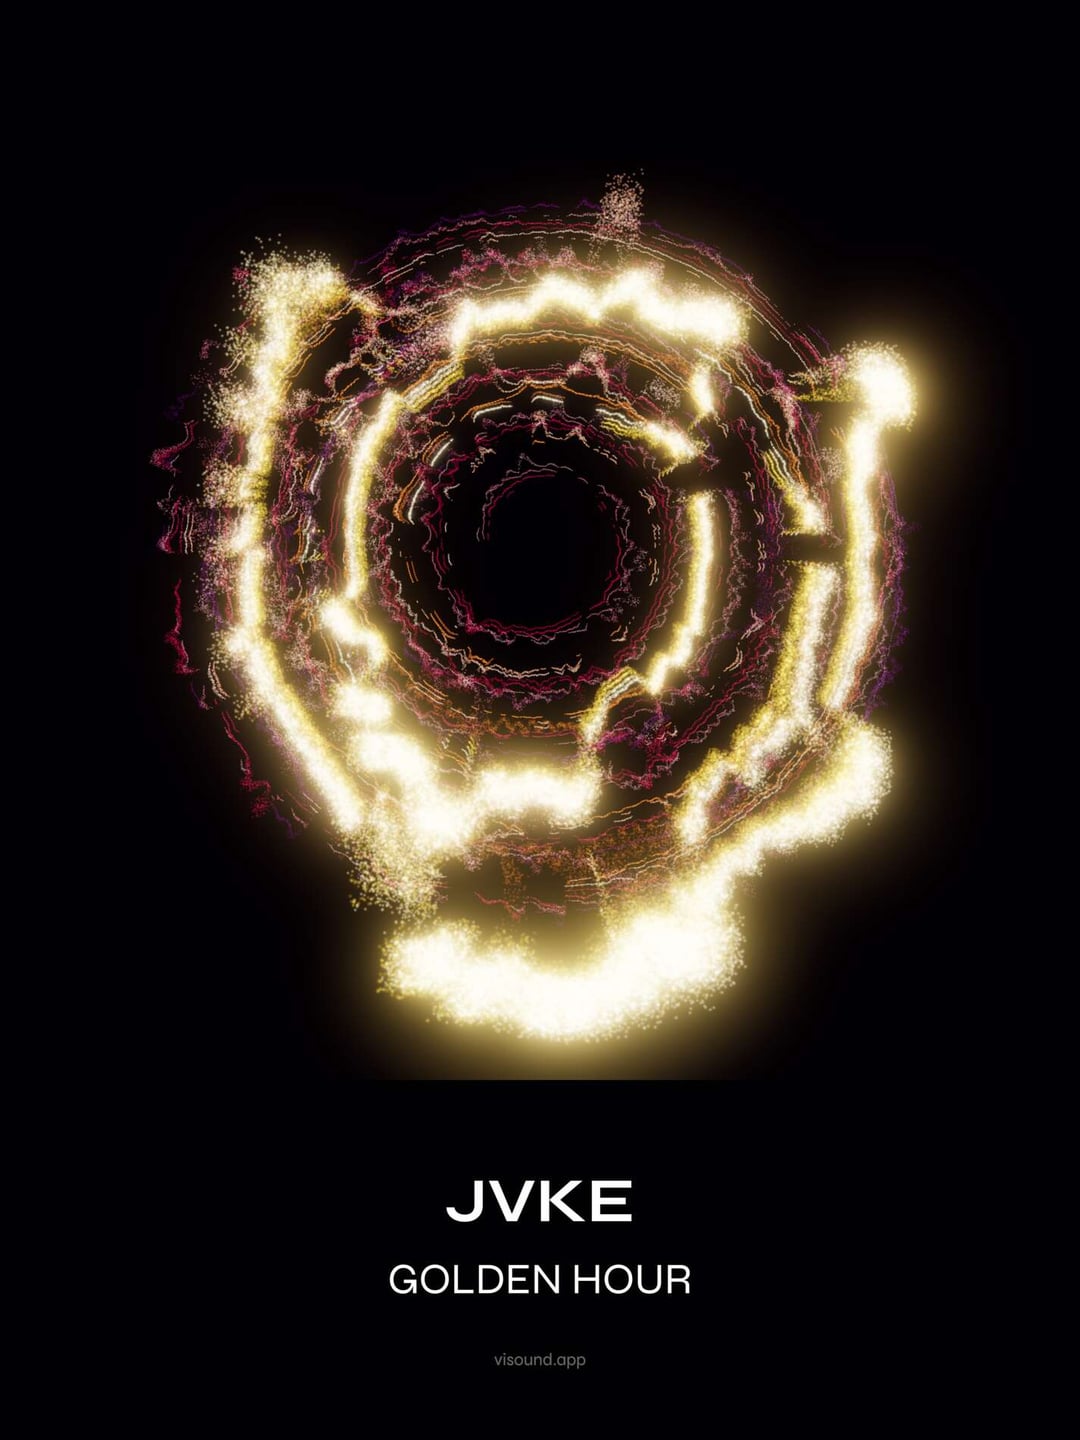
Basically it takes any song, breaks it into 20 frequency bands, and places particles on a spiral based on how loud each band is at any given moment starting from center to outside. More energy = more particles.
What's cool is you can actually see the structure of a song as a full image that you can print and frame. Digging the results so far.
Posted by felipeumanzor
15 Comments
Cool bicycle cassette gears
Cool as a wallpaper or something nice 👍
Beautiful! Maybe a good idea to share with r/synesthesia
Reminds me of Windows Media Player from around 2002.
That’s not meant as shade, I loved watching those visualisations.
This is pretty awesome. Is it outside to in?
/j but why isn’t this a sankey
/uj Finally some ~~good fucking food~~ beautiful fucking data
[deleted]
I want my favorite song done as this and a nice poster size print. Please start the business and take my money
this would be SUPER cool as a Spicetify extension
Interesting, can you give me the link to the visualizer? I’d like to try it on some other pieces.
Dang this is awesome!!
Would love to see some Tipper put through that thing
[removed]
I love that I’m pretty sure I could draw a dot right where the guitar solos start on Bohemian Rhapsody and Comfortably Numb.
This is defiantly something you should try to monetize. I would love to buy a framed print of my favourite song with some customisable colours.
Would be interesting to overlay it on a Harman target FR graph . Or FR graphs of some different headphones
I suspect certain songs/genre that sound better on certain headphones are those with large overlap of your spectral breakdown vs the fr graph. Or maybe there is a point they become shouty. Who knows.