
![Attempt at improving the "The World's Tallest Building (1647-2026)" chart [OC]](https://www.byteseu.com/wp-content/uploads/2026/04/sl79hkqcybvg1-1048x1536.png "Attempt at improving the “The World’s Tallest Building (1647-2026)” chart [OC]")
I saw the original post and then I saw it again on r/dataisugly so i wanted to try my hand at making it more readable.
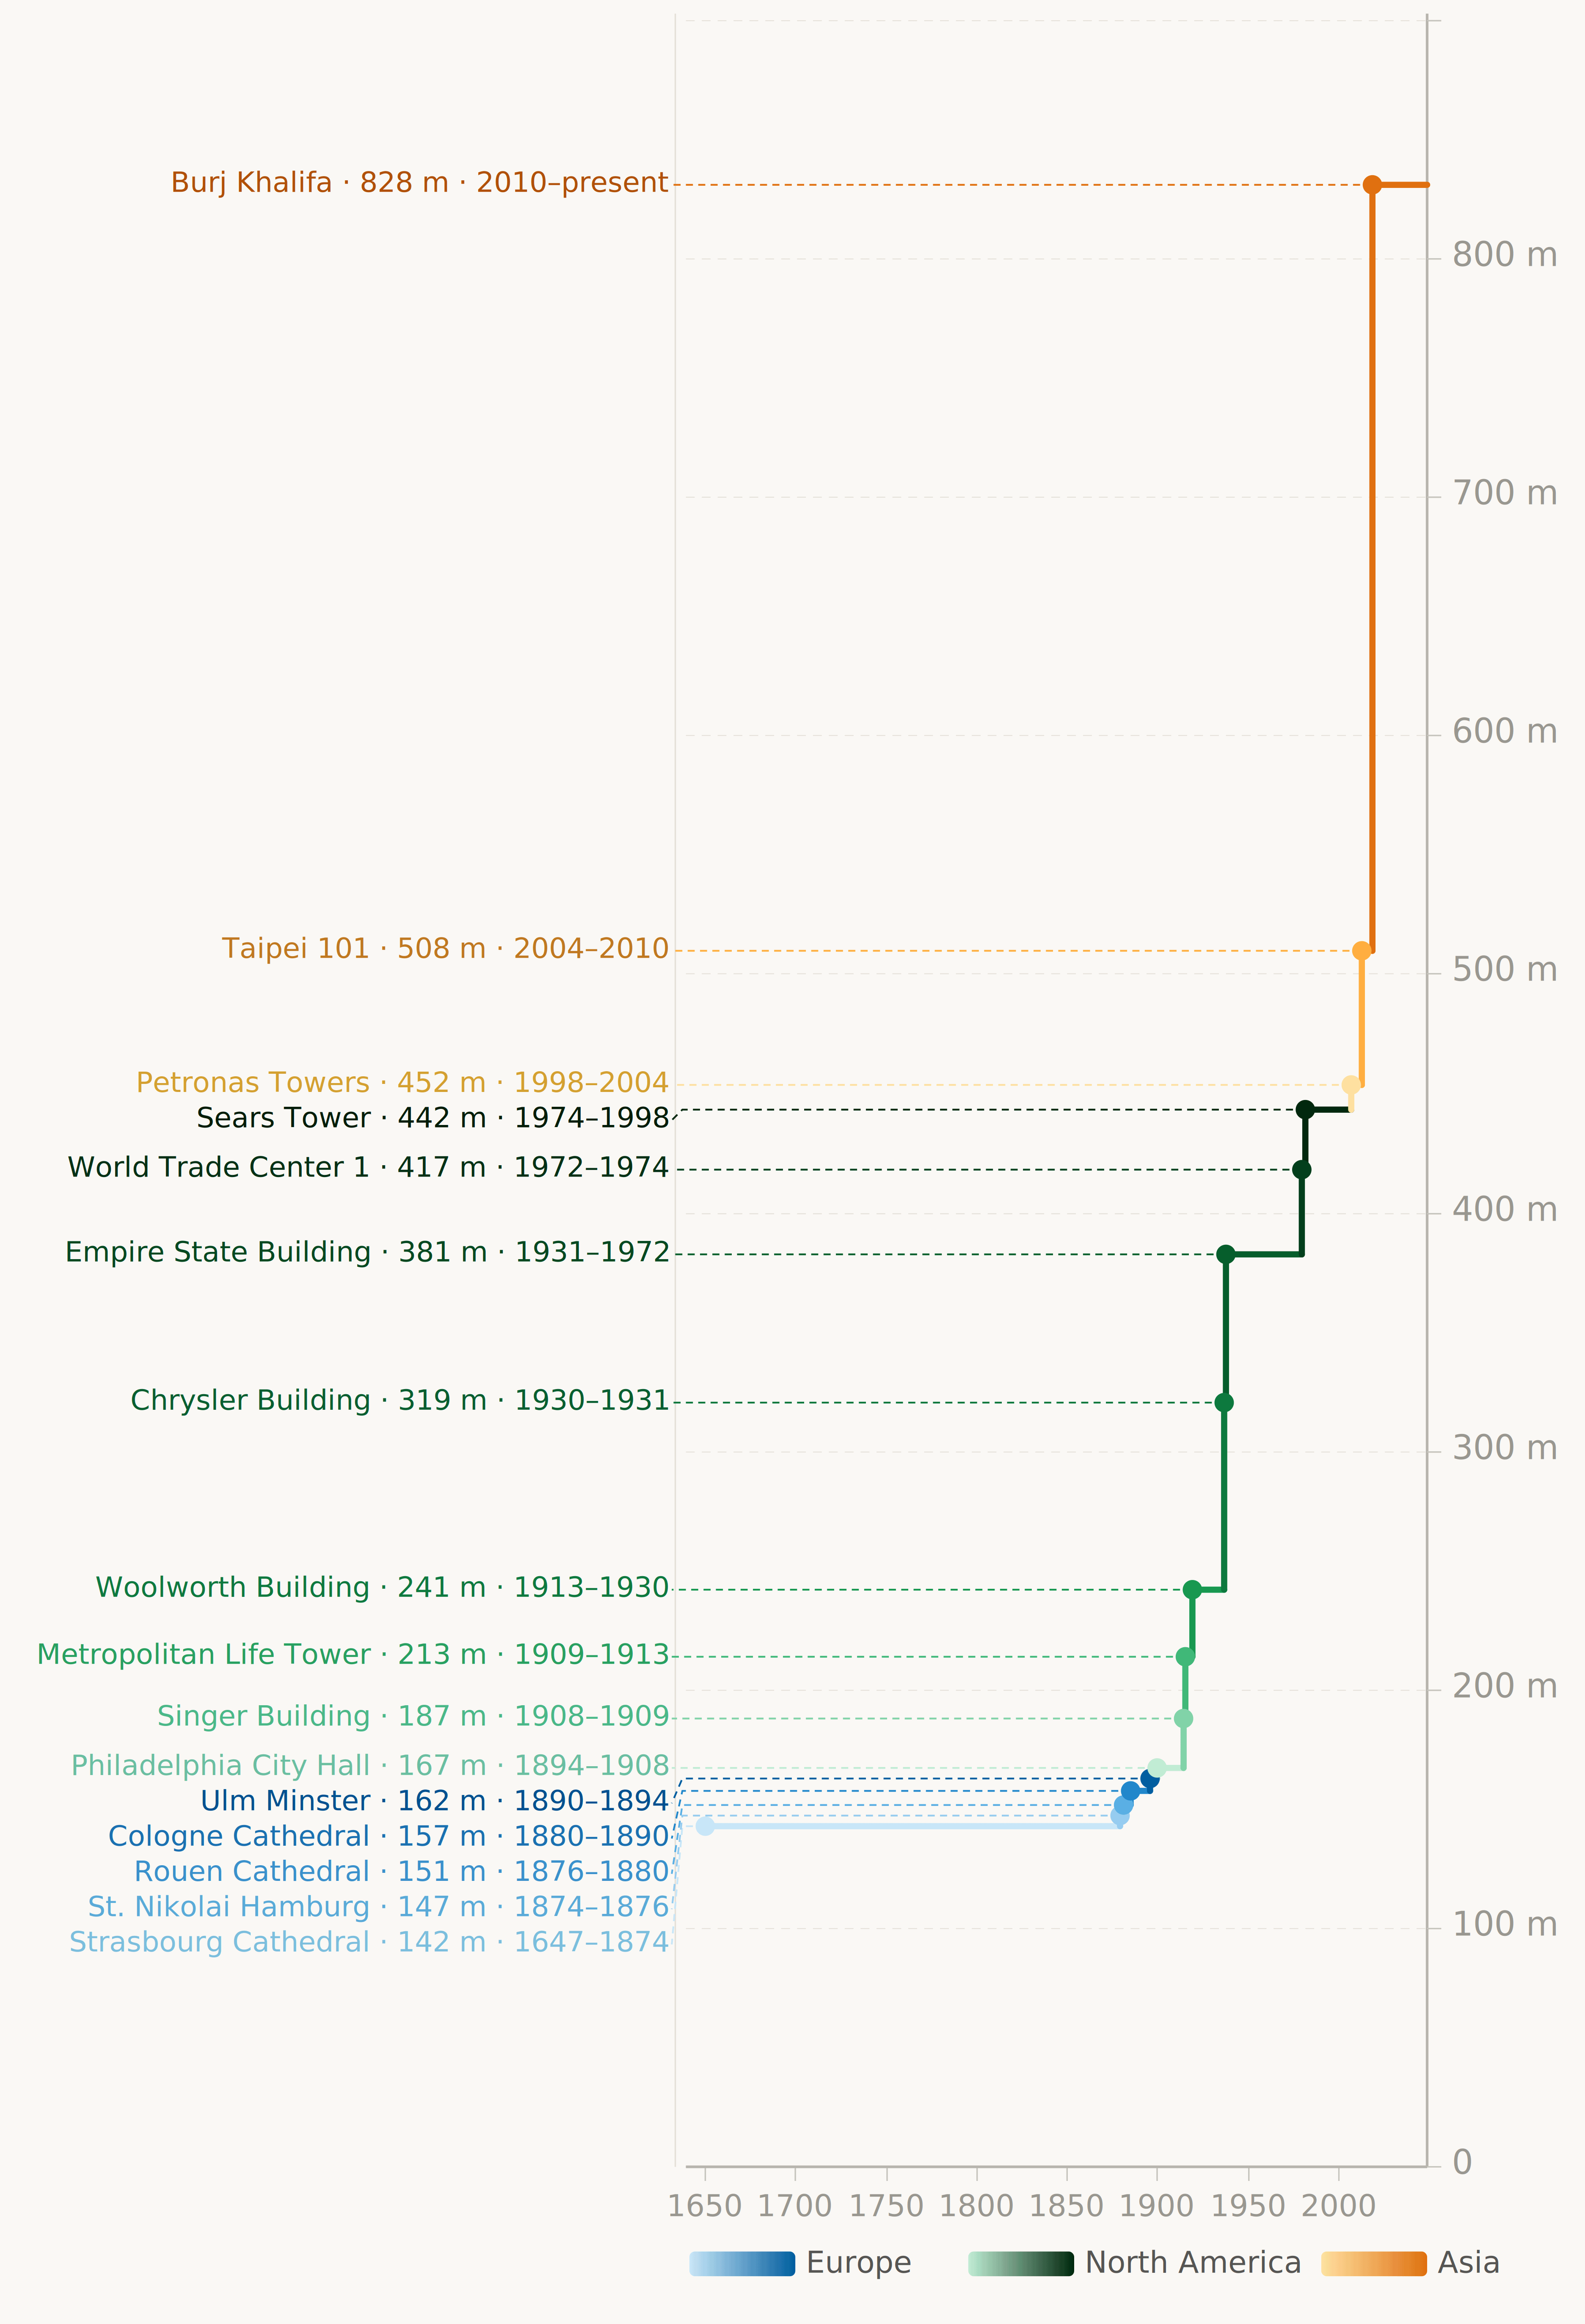
My reflections on the improvements were:
- It begs to have two axis instead of two charts, so I did time on X and height on Y which seemed very logical to me.
- I put the Y axis on the right of the chart because it's closer to the data line for most of the chart and it opened up the left space for the labels.
- I used the UN colors for the continents
- I used gradient to help differentiate the points when they are really close like in the Europe cluster.
I used the same data as the original post: https://data.tablepage.ai/d/world-s-tallest-buildings-record-holders-from-1647-to-2026
And I made the chart entirely with Claude as an SVG then exported it as a PNG.
The exercice was harder than i thought it would be, especially for the label placement. They are the main reason I had to put the Y axis on the right, it's not standard but I think in this case still better.
Not sure how much of an improvement it is, I welcome all kinds of criticism. My only hope is that even though it's not the most beautiful data ever, it doesn't end up being reposted on r/dataisugly as well
edit: forgot to mention but "building" has a surprinsingly strict defintition you can read all about here: https://en.wikipedia.org/wiki/History_of_the_world's_tallest_buildings
that's why the Eiffel tower, the Washington Monument and random radio towers don't appear in this chart. And also why the Pyramids of Giza would not appear either if we went further back in time.
And yes, total height is a super lame metric if we don't include radio towers in the list, we should measure the height of the highest livable floor and substract the spires but I wanted to use the same data as the original post.
Posted by Nirva-Monoceros
31 Comments
In order to achieve that last 320 meters, a proper septic system had to be sacrificed.
Much more intuitive representation than the other graph, and the colours are really nice too
Starting in 1647 makes the timeline unnecessarily compact. I’d start 200 years later just before the Strasbourg Cathedral was overtaken. It doesn’t add much to see that flat line for the full length
Looks good, indeed much better than the other one. Imo though, the axis need different scales because the actual interesting part 1850-present is very short. So I’d make it wider and less tall.
https://preview.redd.it/qaipqbh13cvg1.png?width=749&format=png&auto=webp&s=a07ee63d855e902cb0b68a1bef84e2422fd996d6
Also a little fun fact for you all: during my attempts with Claude, I asked to extend the dataset further back in time. Take it with a grain of salt because it’s “AI data” but it seems some buildings used to be higher but were destroyed:
A lot of people in the comments are missing that the Strasbourg Cathedral being the tallest building for a solid 225 years is very much one of the interesting parts of the chart.
Wasn’t 40 Wall St. the tallest building in the world for a few months in 1930?
Love it!
This way it’s way more readable and just looks nice now.
I think we should do an adjusted height. Like Taipei gets proper earthquakes and I think, talking absolutely out of my ass, that we should adjust for it. I feel it is not the same to build 500 meters in Taipei..
The *city hall* in Philadelphia used to be the world’s tallet building?? Wild.
>edit: forgot to mention but “building” has a surprinsingly strict defintition you can read all about here: [https://en.wikipedia.org/wiki/History_of_the_world’s_tallest_buildings](https://en.wikipedia.org/wiki/History_of_the_world's_tallest_buildings)
that’s why the Eiffel tower, the Washington Monument and random radio towers don’t appear in this chart. And also why the Pyramids of Giza would not appear either if we went further back in time.
Indeed:
“The non-profit international organization [Council on Tall Buildings and Urban Habitat](https://en.wikipedia.org/wiki/Council_on_Tall_Buildings_and_Urban_Habitat) (CTBUH), which maintains a set of criteria for determining the height of tall buildings, defines a “building” as “(A) structure that is designed for residential, business or manufacturing purposes” and that “has floors”.”
For the Eiffel Tower, this is controversial in my opinion. It has floors, Gustave Eiffel had an office and an apartment on the last floor, there was a theatre on the first floor, restaurants… At the opposite, saying that a church has a «business purpose» is far fetched.
id probably make a separation between middle east and east/southeast asia.
I hope there’s “space elevator” on this chart in the future.
Sears Tower was screwed when the Petronas towers were completed. It still had highest roof and highest occupiable floor, but the spires on the Petronas Towers was counted, but the rather substantial freestanding on the Sears Tower weren’t.
Much better. Go backwards and add the Great Pyramids!
Time for Philadelphia to build a new City Hall.
Where is the Eiffel tower ? It is still missing.
I’m the OC of the criticized graph. Thanks for improving it! (and now I do not have to). I really like the color gradient.
One thought I had about your version: I wonder whether a filled bar chart might work better than a line chart, especially for making Strasbourg Cathedral stand out more. Another option might be to fill only the incremental section, as in just the added height above the previous tallest. It also might help to stretch the x-axis a bit.
Great visual!
~~The Great Pyramid of Giza (Pyramid of Khufu) is 146.5 meters (c. 2589–2566 BC)~~
Between Taipei 101 and Burj Khalifa are 6 other supertall buildings.
It’d be rather different if you included structures like the Warsaw radio mast and the KVLY TV mast
I’m still surprised that thing hasn’t fallen over, built on top of a sandbox and nearly twice as tall as the next tallest building
In two years the Burj will also have held the record for the longest, out of all of them? That’s very inpressive
Wow this is so much better than the other version
Much better, but the colors seem kinda random and don’t seem to convey actual information, and some of them are really hard to read.
Also, by putting the text inside the graph window, and moving the oldest building’s name elsewhere, you can make the entire graph 2x as wide, making all the information much easier to read, instead of cramping everything except 1 thing in the rightmost 1/5 of the image.
Sorry OP, I reposted thep original dataisugly. Kind of a jerk move. Thanks for your creativity and persistence!
Continent colours are a great idea, they really demonstrate that Europe was surpassed by North America, which has now been surpassed by Asia.
the chart itself looks like a skyscraper
Man I totally forgot that the Philly City Hall used to be the world’s tallest building. Nowadays it’s completely surrounded by skyscrapers.
You missed 40 wall street, it was completed in 1929 and held the record for only a few months!!!!
I was like, sears towers? I used to lived next to that in LA. But its not that one