
![[OC] Counting The Dead - A Relative Risk Analysis Of Civilian Mortality In 52 Armed Conflicts](https://www.byteseu.com/wp-content/uploads/2026/04/xluyjnjfitvg1-1158x1536.png "[OC] Counting The Dead – A Relative Risk Analysis Of Civilian Mortality In 52 Armed Conflicts")
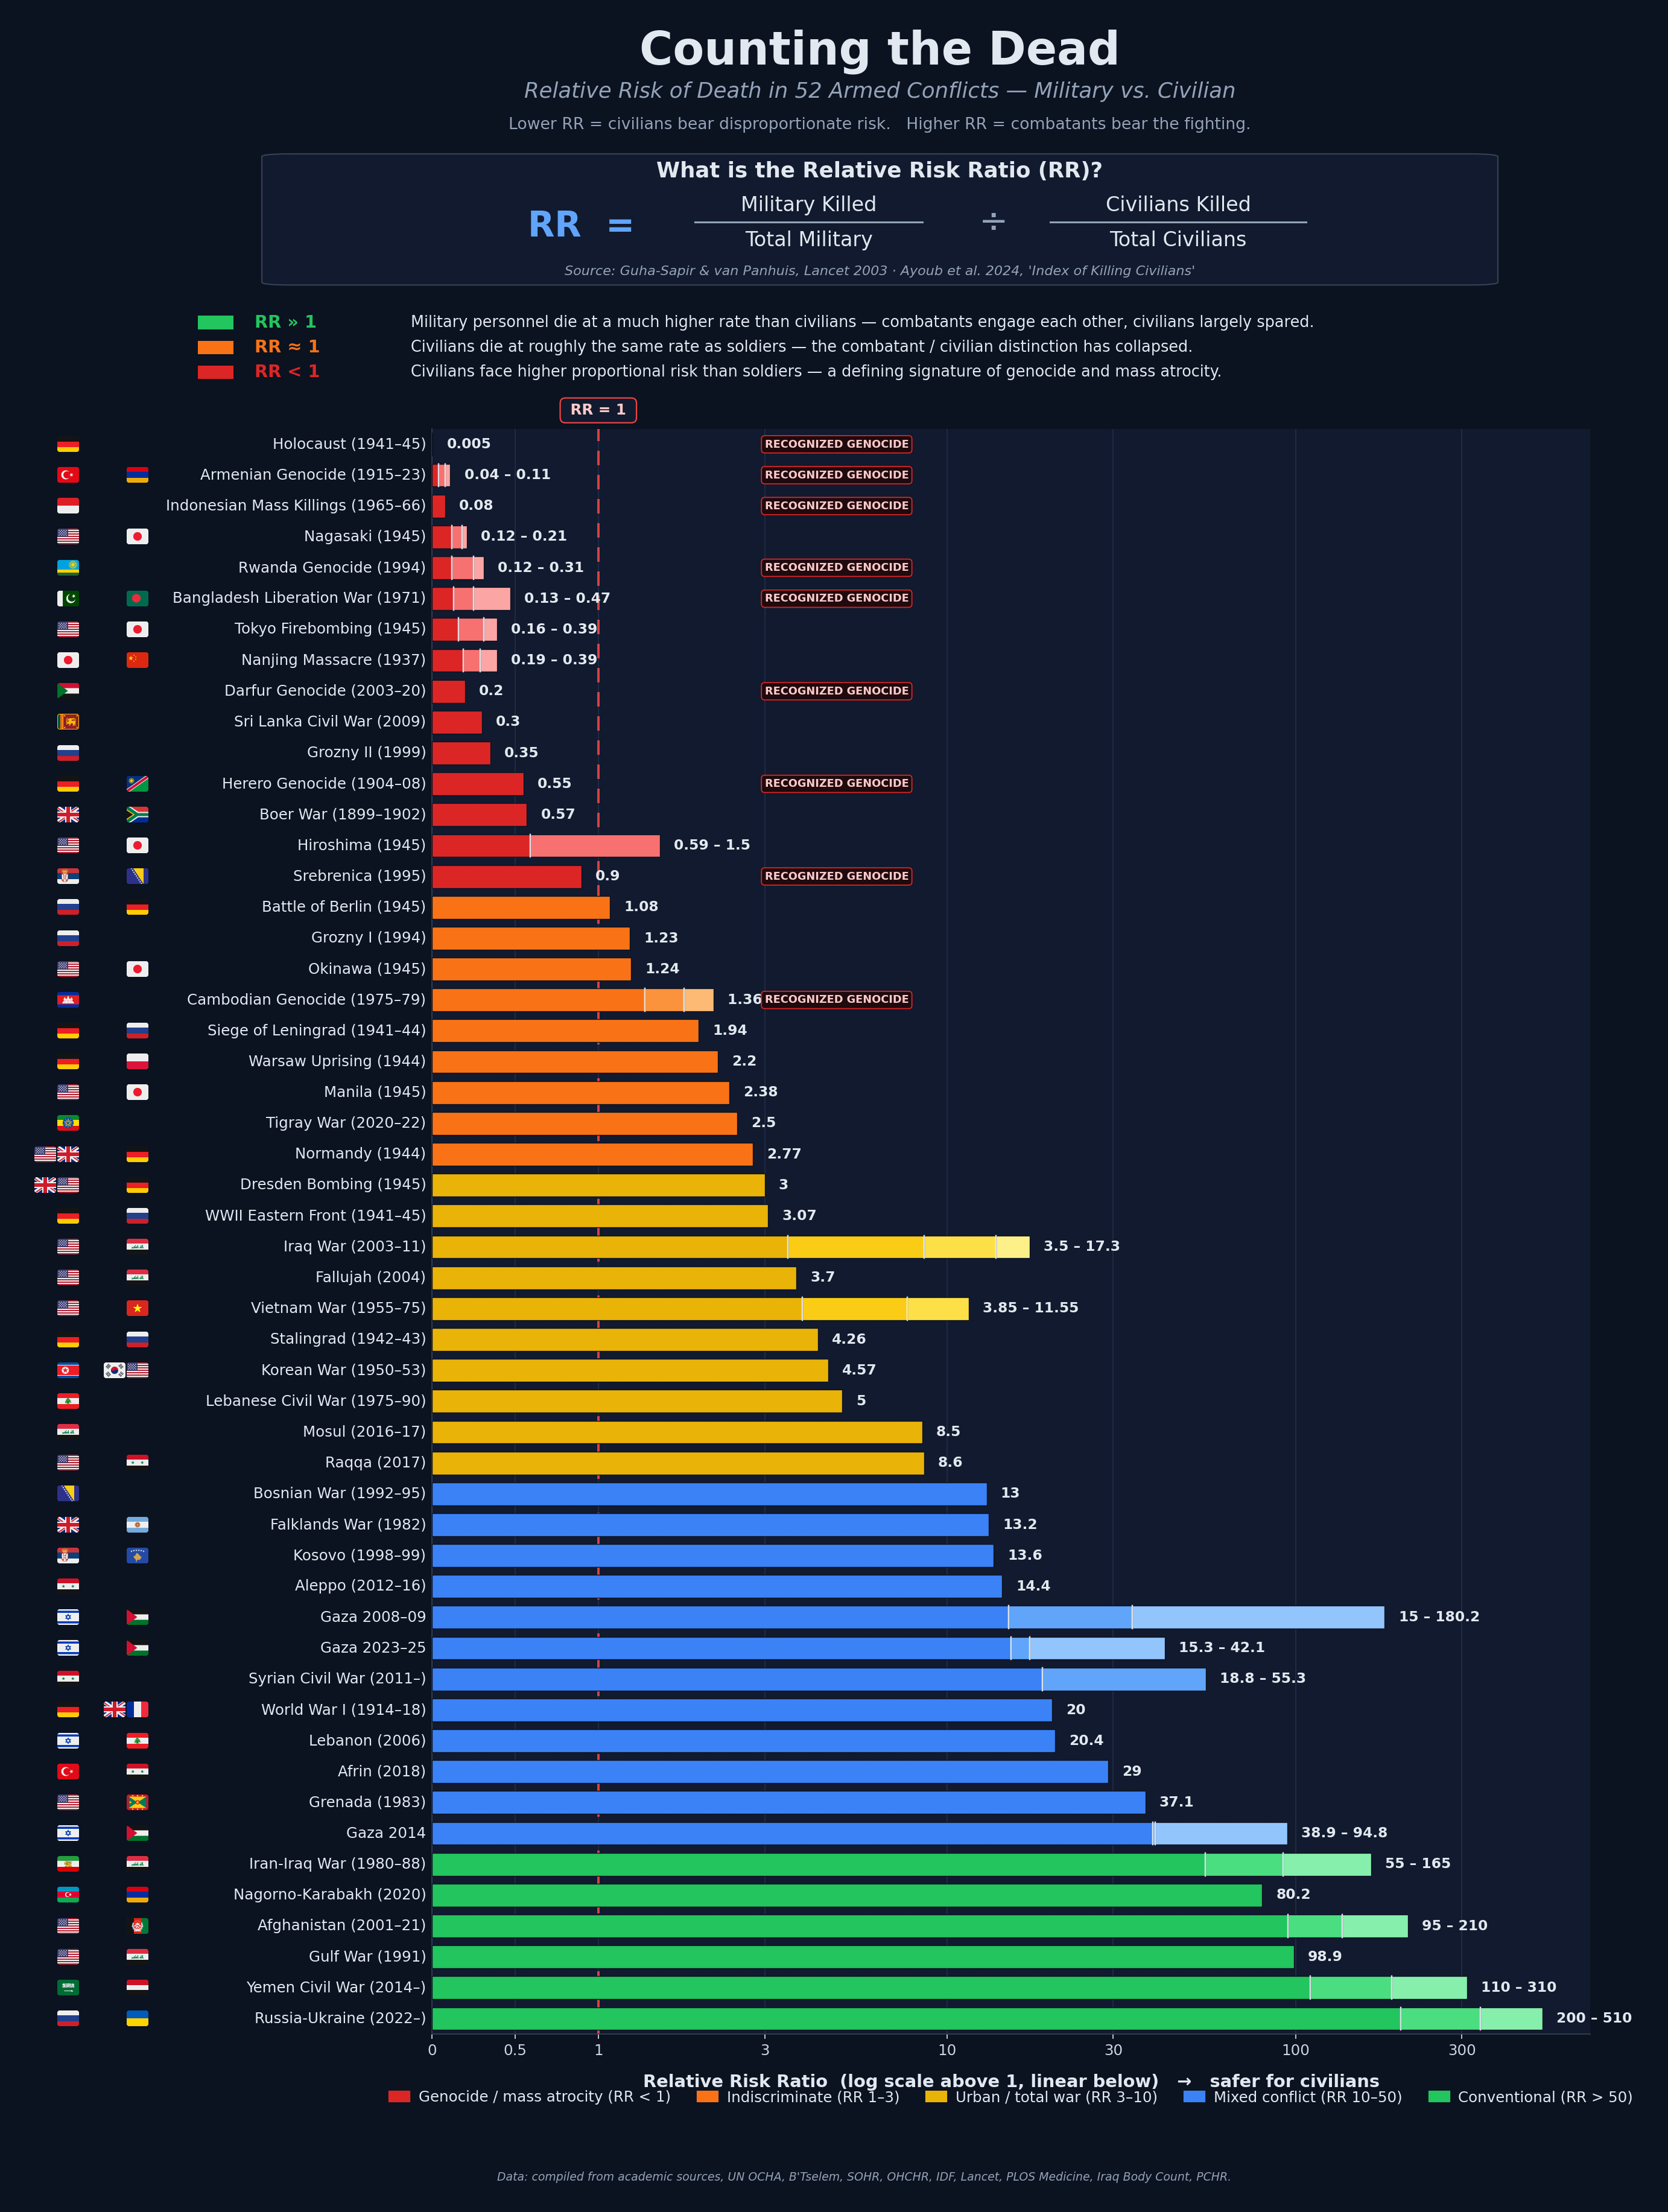
This analysis is intended to understand the Relative Risk Ratio (RR) of death across 50+ armed conflicts since the dawn of the 20th century.
RR = (Military killed / Total military) ÷ (Civilians killed / Total civilians)
Stemming from Epidemiology,Relative risk (RR) is a key measure used to compare the probaility of events happening in exposed populations vs unexposed populations.
- RR < 1 – civilians die at a higher proportional rate than soldiers (signature of genocide / mass atrocity)
- RR ≈ 1 – civilian/combatant distinction has collapsed
- RR » 1 – soldiers bear the fighting; civilians largely spared
Bars are on a log scale Where credible sources disagree the bar becomes a stacked range: lighter shades mark each source.
Posted by JoshuaJosephson
30 Comments
I am genuinely surprised by Gaza 2023-25 score, any idea why it’s so high?
Really, really interesting chart!
People are going to downvote this because it conflicts with their viewpoint that the wars in Gaza were genocides.
Bruh
https://preview.redd.it/i5ry9z1gotvg1.png?width=1100&format=png&auto=webp&s=cb102da02b44c8390d881be56f1147a3b5b541dc
Data: IDF ? Why would you ever use an active party as your source ?
Tools – Python 3 + Matplotlib 3.10 + NumPy 2.4.
Sources –
# General / methodology
* **Guha-Sapir & van Panhuis**, “Conflict-related mortality: an analysis of 37 datasets,” *Disasters* 2004 — [doi:10.1111/j.0361-3666.2004.00256.x](https://doi.org/10.1111/j.0361-3666.2004.00256.x)
* **Ayoub et al. (2024)**, “An Index for Killing Civilians” — [Brookings](https://www.brookings.edu/articles/an-index-for-killing-civilians/)
* **Roberts, A.**, “Lives and Statistics: Are 90% of War Victims Civilians?” *Survival* 52(3), 2010 — corrective on the often-misquoted “90% civilian” claim
* **Rummel, R.J.**, *Statistics of Democide* (1997) — historical baseline for pre-1990 conflict mortality
* **Uppsala Conflict Data Program (UCDP)** — [ucdp.uu.se](https://ucdp.uu.se/) — standing reference for battle-related deaths
# Per-conflict
* **Holocaust (1941–45)** — [USHMM](https://encyclopedia.ushmm.org/content/en/article/documenting-numbers-of-victims-of-the-holocaust-and-nazi-persecution). Plotted at 0.005 because log scale can’t display zero; the actual narrow-framing RR is ~10⁻³–10⁻⁴.
* **Armenian Genocide (1915–23)** — range: Akçam, *A Shameful Act* (2006) ~800k low end / [Armenian National Institute compilation](https://www.armenian-genocide.org/statistics.html) / Dadrian 1.5M high end.
* **Indonesian Mass Killings (1965–66)** — Cribb (2001); [CIA 1968 declassified study](https://www.cia.gov/readingroom/document/cia-rdp80t01762a000300070001-2).
* **Nagasaki (1945)** — range: [USSBS (1946)](https://www.trumanlibrary.gov/library/research-files/united-states-strategic-bombing-survey-effects-atomic-bombs-hiroshima-and) 45k / mid / Nagasaki City 70k.
* **Darfur Genocide (2003–20)** — [CRED/IRIN via ReliefWeb](https://reliefweb.int/report/sudan/darfur-mortality-update-2008); [GAO-07-24](https://www.gao.gov/products/gao-07-24).
* **Bangladesh Liberation War (1971)** — range: academic low ~800k / Rummel ~1.5M / Bangladeshi government 3M. Pakistani figures are much lower and politically contested.
* **Rwanda Genocide (1994)** — range: low academic 400k / [HRW *Leave None to Tell the Story*](https://www.hrw.org/reports/1999/rwanda/) 507k / Rwandan government 1.07M.
* **Nanjing Massacre (1937)** — range: mid ~150k / IMTFE 200k / PRC official 300k. Chang, *The Rape of Nanking* (1997). (Excludes Japanese revisionist figures.)
* **Sri Lanka — Mullivaikkal (2009)** — [UN Panel of Experts Report, 2011](https://www.un.org/en/genocideprevention/documents/POE_Report_Full.pdf).
* **Tokyo Firebombing (1945)** — range: USSBS 80k / Selden (“A Forgotten Holocaust”) 100k / Japanese post-war survey 200k.
* **Grozny II (1999)** — [HRW *Welcome to Hell*](https://www.hrw.org/reports/2000/russia_chechnya4/).
* **Herero Genocide (1904–08)** — Olusoga & Erichsen, *The Kaiser’s Holocaust* (2010).
* **Boer War (1899–1902)** — Pakenham, *The Boer War* (1979); concentration camp mortality figures.
* **Hiroshima (1945)** — range: USSBS low / Second Army HQ garrison count high — [Atomic Heritage Foundation](https://ahf.nuclearmuseum.org/ahf/history/bombings-hiroshima-and-nagasaki-1945/).
* **Srebrenica (1995)** — [ICTY, *Prosecutor v. Krstić*](https://www.icty.org/case/krstic/4); ICMP DNA identifications.
* **Battle of Berlin (1945)** — Beevor, *Berlin: The Downfall* (2002).
* **Grozny I (1994)** — HRW; Memorial archive.
* **Okinawa (1945)** — [US Army CMH *Okinawa: The Last Battle*](https://history.army.mil/html/books/005/5-11-1/index.html).
* **Cambodian Genocide (1975–79)** — range: Etcheson (Yale CGP) 1.4M / Kiernan, *The Pol Pot Regime* (2008) 1.7M / Heuveline, *Population Studies* (1998) 2.2M.
* **Siege of Leningrad (1941–44)** — Glantz, *The Battle for Leningrad* (2002).
* **Warsaw Uprising (1944)** — [Warsaw Rising Museum](https://www.1944.pl/en/article/casualties-of-the-warsaw-rising,4736.html).
* **Manila (1945)** — Connaughton et al., *The Battle for Manila* (1995).
* **Tigray War (2020–22)** — [Ghent University excess-mortality estimate, 2023](https://www.ugent.be/ps/conflict-development/en/news-events/news/tigray-mortality.htm).
* **Normandy (1944)** — [US Army Green Books *Cross-Channel Attack*](https://history.army.mil/html/books/007/7-4/index.html).
* **Dresden (1945)** — Dresden Historians’ Commission Report (2010).
* **WWII Eastern Front (1941–45)** — Krivosheev, *Soviet Casualties and Combat Losses* (1997).
* **Fallujah (2004)** — [Iraq Body Count analysis](https://www.iraqbodycount.org/analysis/numbers/).
* **Stalingrad (1942–43)** — Beevor, *Stalingrad* (1998).
* **Korean War (1950–53)** — [US DoD DCAS](https://dcas.dmdc.osd.mil/dcas/app/conflictCasualties/korea); DPRK/ROK figures.
* **Lebanese Civil War (1975–90)** — Hanf, *Coexistence in Wartime Lebanon* (1993).
* **Vietnam War (1955–75)** — range: revised low ~1M / [Hirschman, Preston & Vu, *Pop. & Dev. Review* (1995)](https://www.jstor.org/stable/2137793) ~1.5M / Vietnamese government ~3.1M.
* **Mosul (2016–17)** — [Amnesty *At Any Cost*](https://www.amnesty.org/en/documents/mde14/6610/2017/en/).
* **Raqqa (2017)** — [Amnesty *War of Annihilation*](https://www.amnesty.org/en/documents/mde24/8367/2018/en/).
* **Iraq War (2003–11)** — range (low→high): [IBC](https://www.iraqbodycount.org/) direct / WHO IFHS 2008 / [PLOS Med 2013 (Hagopian)](https://journals.plos.org/plosmedicine/article?id=10.1371/journal.pmed.1001533) / [Lancet 2006 (Burnham)](https://www.thelancet.com/journals/lancet/article/PIIS0140-6736(06)69491-9/fulltext).
* **Falklands War (1982)** — UK MoD; Argentine Defence Ministry.
* **Bosnian War (1992–95)** — [RDC Sarajevo *Bosnian Book of the Dead*](https://www.idc.org.ba/).
* **Aleppo (2012–16)** — [SOHR casualty data](https://www.syriahr.com/).
* **Syrian Civil War (2011–)** — range: [OHCHR June 2022 update](https://www.ohchr.org/en/press-releases/2022/06/un-human-rights-office-estimates-more-306000-civilians-were-killed-over-10) low / [SOHR cumulative](https://www.syriahr.com/en/) high.
* **Kosovo (1998–99)** — [HRW *Under Orders*](https://www.hrw.org/reports/2001/kosovo/).
* **Gaza 2023–25** — range: high-civilian estimate / [Lancet 2024 (Khatib et al.)](https://www.thelancet.com/journals/lancet/article/PIIS0140-6736(24)01169-3/fulltext) / IDF combatant claims. Figures from [Gaza Health Ministry via OCHA](https://www.ochaopt.org/). Active conflict — numbers evolving.
* **World War I (1914–18)** — Urlanis, *Wars and Population* (1971); aggregated from CWGC, US/French/German official histories.
* **Lebanon War (2006)** — [HRW *Why They Died*](https://www.hrw.org/report/2007/09/05/why-they-died/civilian-casualties-lebanon-during-2006-war).
* **Afrin (2018)** — [SOHR Afrin tally](https://www.syriahr.com/en/87571/).
* **Grenada (1983)** — US DoD Operation Urgent Fury after-action report.
* **Gaza 2008–09 (Cast Lead)** — range: [PCHR](https://www.pchrgaza.org/) / [B’Tselem](https://www.btselem.org/statistics/fatalities/during-cast-lead/by-date-of-event) / IDF. Source choice moves the conflict between two entirely different categories.
* **Gaza 2014 (Protective Edge)** — range: [OCHA](https://www.ochaopt.org/content/key-figures-2014-hostilities) / B’Tselem / IDF.
* **Nagorno-Karabakh (2020)** — Armenian/Azerbaijani MoD; [HRW report](https://www.hrw.org/news/2021/03/25/azerbaijan-unlawful-strikes-nagorno-karabakh).
* **Iran-Iraq War (1980–88)** — range: low ~500k / mid ~750k / high 1M+. Hiro, *The Longest War* (1991); MoD figures both sides.
* **Gulf War (1991)** — [US DoD *Conduct of the Persian Gulf War* (1992)](https://apps.dtic.mil/sti/citations/ADA248750).
* **Afghanistan (2001–21)** — range: UNAMA narrow direct-violence / [Costs of War (Brown)](https://watson.brown.edu/costsofwar/) / upper direct+indirect.
* **Yemen Civil War (2014–)** — range: [ACLED](https://acleddata.com/) narrow direct / mid / [UNDP *Assessing the Impact*](https://www.undp.org/yemen/publications/assessing-impact-war-yemen-pathways-recovery) high direct+indirect.
* **Russia-Ukraine (2022–)** — range: conservative civilian ([OHCHR](https://ukraine.un.org/en/resources/publications) verified) with [Mediazona/BBC](https://en.zona.media/article/2024/01/12/casualties_eng) Russian KIA / mid / higher civilian estimates.
Crazy to see that Nanjing is not recognised as a genocide
Reposting my comment:
Puts modern day into perspective, and trends show that total war/independent actors are way deadlier than limited conflicts involving proper states
Raqqah (2017) was SDF (kurds) vs islamic state, not USA VS Syria
Very interesting analysis, even with all the nuance that we could argue about.
Concerning the Iraq-Iran war 1980-1988, I think that thousands of young boys brainwashed to wear military uniforms, don a key around their neck and run into the field, would like to have a word with you about the nuances in the distinctions between mil/civ.
No credibility with the IDF as a source. It’s like getting holocaust numbers from the Wehrmacht.
Dahm didn’t expect Russia-Ukraine to be so high. Really shows that both sides claim of genocide is BS. On the other hand, the extremely high military casualties on both sides are probably driving this number so high
Why are some events counted separately, and others aggregated into a broader conflict? This is comparing 2 different type of events by the same metric.
I find this rating very wired how can you say at 1 civilians and combatant distinction has collapsed – if the fighting force is much smaller then the civilian population this metric falls apart. If the army is 10k and there are 1 mill civilians killing 2k soldiers and 100k civilians would be genocide most likely but gets you an RR of 2.
Fuck the list where Israel is not in top 5.
So others have mentioned not finding this data credible for several conflicts, and I think a lot of the discrepancy comes down to what counts as a military casualty. Take Vietnam for example: I don’t know exactly how that was calculated, but there are documented cases of civilians being killed and various forces claiming they were legitimate military targets. The My Lei massacre is a failed example, but some reports have come out saying there was ‘a My Lei a month’ during parts of the war.
You see the same in Afghanistan and Iraq. Particularly early on the in the war(sorry, military action), cluster bombs were used on targets in populated areas. In Fallujah, an ‘uprising’ was put down rather brutally and more or less caused by the actions of the American Occupation towards civilians. Are they counted as combatants or civilians?
The point is that someone being recorded as a ‘military’ or ‘civilian’ target can be as much a matter of who is counting as it is who is actively fighting.
When I look at the amount of buildings and infrastructure destroyed in Gaza I find it absolutely impossible to believe this chart.
Some day, East Timor will be included in such charts. 1975-1999, about 1/3 of the population killed by the Indonesian military (with the crucial help of the US). Virtually all of them civilians. Relative to population perhaps the worst since the Holocaust. My PhD is in International Relations and over the decades the profound ignorance about it in my field never ceased to amaze/anger me.
Do you have numbers for WW2 as a whole, both with and without the genocides? I’d be interested to see how that shifts the ratio.
I’m sorry, how is Gaza that high on the “Military Casualties almost exclusively” scale?!
Where did you get these figures from? It’s from Israel’s numbers where they consider every single Arab a legitimate combatant, isn’t it?
Gaza in there 3 times is heartbreaking and undoubtedly it’s a genocide
Just as a note for Afghanistan, Gaza and the war in Iraq. Because one side didn’t have proper documentation, practically all fighting age men are sometimes considered combatants if they die nearby a known combatant.
.005 is insane, even in the context of other atrocities.
We really need to be more forceful against people who draw Holocaust comparisons and engage in Holocaust denial and inversion.
Bullshit of a bullshit of a bullshit, only you can find in reddit.
Fantastic chart and fantastic post. This is irrefutable evidence that puts to bed the ridiculous notion that Israel has committed genocide in Gaza. And, contextualizes the absurdity of the antisemitic comparisons to the nazis’ Holocaust.
I can’t help but wonder if the numbers don’t trend upward as you get closer to the present because we’re better at *documenting* it.
The Gaza genocide is also a recognized genocide by the ICC, the same body which determined Rwanda and Srbrenica to be genocides. Why doesnt it include this fact in the chart?
This is bullshit, but with a graph
You don’t know either the civilian or military death toll in Ukraine. What is the civilian death toll in the occupied territories? When russia forcibly mobilized most of the male population of Donbas ages 18-65 and sent them to die at the front, would those be “military” deaths? When russia blew up the Kakhovka dam and flooded hundreds of villages, are those deaths due to a “natural disaster”?
Ukraine values preserving lives (both civilian and military) above all, and they have put a very determined defense – and they help civilians evacuate before they have to withdraw from towns. Because of that, yes, the civilian deaths have probably been much less than the worst case scenario. However, when they have been overrun (especially in the first year of the war), the civilian death toll is brutal.
Mariupol had a prewar population of 425,000; only around 100,000 managed to evacuate before the siege. The current population is 120,000. Where are the other 200,000? It’s unclear exactly how many managed to leave during or after the siege (it’s not as though anyone can go there to investigate) and how many were killed, but all available evidence suggests a large part of the total population of the city was killed in the siege. UCDP estimated 27,000 to 88,000 civilians killed [https://ucdp.uu.se/country/369](https://ucdp.uu.se/country/369) and AP estimated 51,500 square meters of (mass) graves in satellite photos [https://apnews.com/article/russia-ukraine-war-erasing-mariupol-methodology-f74b28016b8dea4b82811655f14931f2](https://apnews.com/article/russia-ukraine-war-erasing-mariupol-methodology-f74b28016b8dea4b82811655f14931f2) The number of Ukrainian soldiers killed is 900-1,200. So based on this the risk ratio for just Mariupol is around **0.01 to 0.04**, much lower than Nagasaki’s 0.18.
There are also many documented cases of mass killing in occupied territories outside of combat. Here is a mass grave with 414 executed civilians that was found in Izium, a city of about 45,000 that was occupied by russia in April 2022 and liberated in September 2022. [https://en.wikipedia.org/wiki/Izium_mass_graves](https://en.wikipedia.org/wiki/Izium_mass_graves) (that grave also had 22 soldiers, risk ratio 0.05). This is not an isolated case, rather a systematic policy, as russian troops during the initial invasion were found carrying lists of civilians to capture and kill.
https://preview.redd.it/guyybsu3wtvg1.png?width=750&format=png&auto=webp&s=7ec41a41cee79e6d06fe79272d7e928c54e2fe0a
If the graph is trying to show “the russian invasion of Ukraine is not a genocide”, it is absolutely failing at that if the correct data is used. It is not only a genocide but one of the ones that show the most systematic deliberate targetting of civilians out of any on that list. The only difference is that Ukraine has been exceptionally good at defense, and so most civilians who didn’t end up in under occupation early in the war have been spared the worst of it – no thanks to russia.
This is, frankly, an absolutely disgusting piece of pro-genocide apologism, and I recommend you delete it.
Where was data for Armenian Genocide taken from?
So half of the Jews in europe were killed in the holocaust, so that would be an X2 on the civilian side ( up to 1) . Since the ratio is calculated as 0.005, that gives us a 0.0025 ratio of jews joining the military vs the jews dying in said military.
Claiming that only 1 out of 400 ( up to 200) Jewish soldiers that joined ended up dying in WW2 is an anti-semitic trope about jewish soldiers not actually fighting.
No fighting force in WW2 suffered such low casualties.
Relative risk is weird here. Would be interesting to see this side by side with a total civilian death count comparison to see how those measures correlate