Recently, the Dark Energy Spectroscopic Instrument (DESI) team released the largest 3D map of our universe ever created. When I first saw the raw data image, my brain immediately tried to process it as a local nebula—something like the Carina or Orion gas clouds.
But the reality of this image is much more profound.
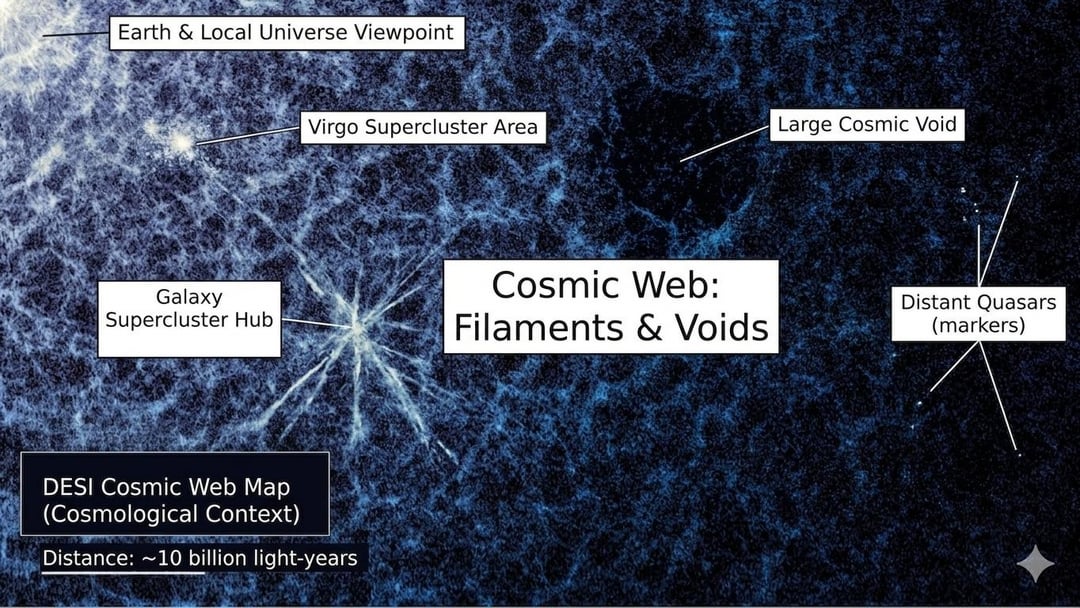
Every single microscopic point of light you see here is not a star. It is an entire galaxy or quasar, each containing billions of stars of its own. The bright white light on the far left represents our local viewpoint on Earth. As your eyes move to the right, you are looking deeper into space, and therefore, further back in time.
I put together a few mapped versions and zoomed-in crops to help visualize the actual architecture of the cosmos we are looking at. (Swipe through the gallery to follow along!)
Image 1 & 2: The Cosmic Web Map
On a cosmological scale, gravity has pulled matter into an incredibly complex, sponge-like structure known as the “Cosmic Web.” You can clearly see how galaxies are not scattered randomly; they are strung along massive filaments of dark matter, forming the largest continuous structures in existence. The distance from the left edge to the right edge of this image is roughly 10 to 11 billion light-years.
Image 3: The Supercluster Cores (Zoom 1)
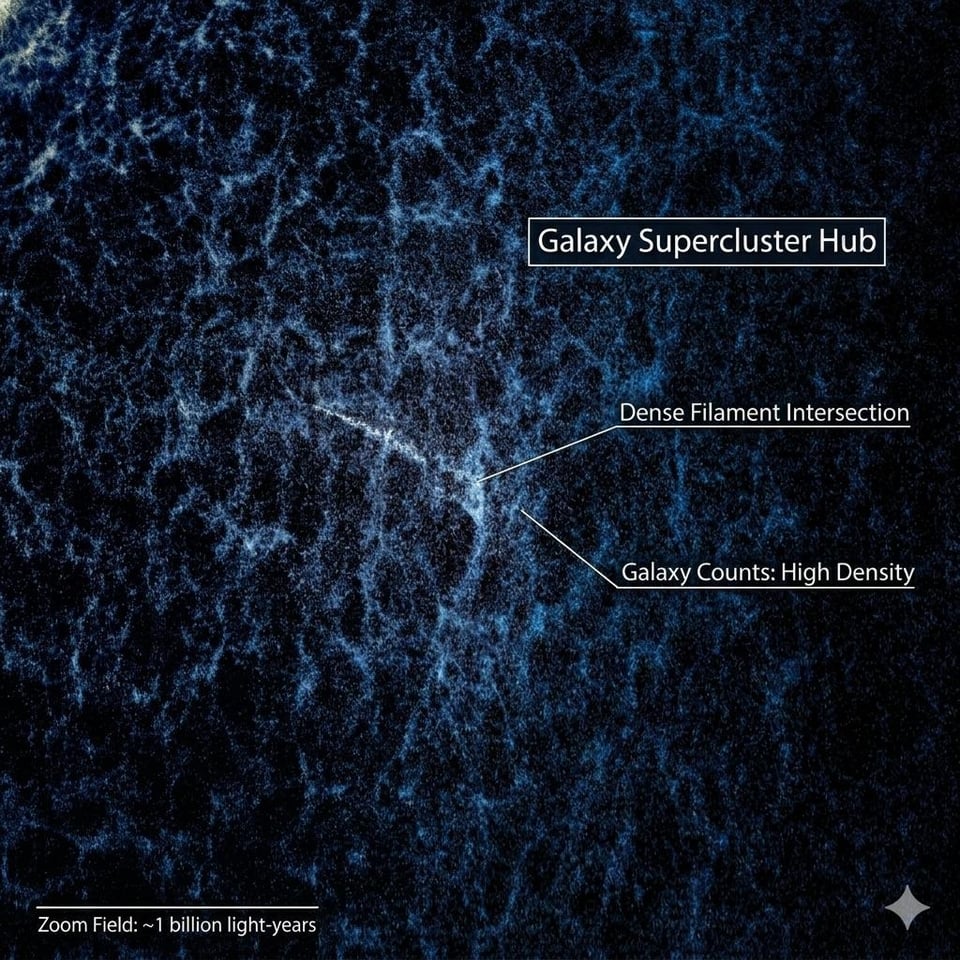
In this crop, we are looking at the heavy gravitational “city centers” of the universe. Where massive dark matter filaments intersect, galaxy clusters are drawn together to form Superclusters. These extremely dense hubs contain thousands of individual galaxies bound together by gravity. If you were standing on a planet inside one of those dense filament intersections, your night sky would be absolutely ablaze with neighboring galaxies.
Image 4: The Deep Cosmic Voids (Zoom 2)
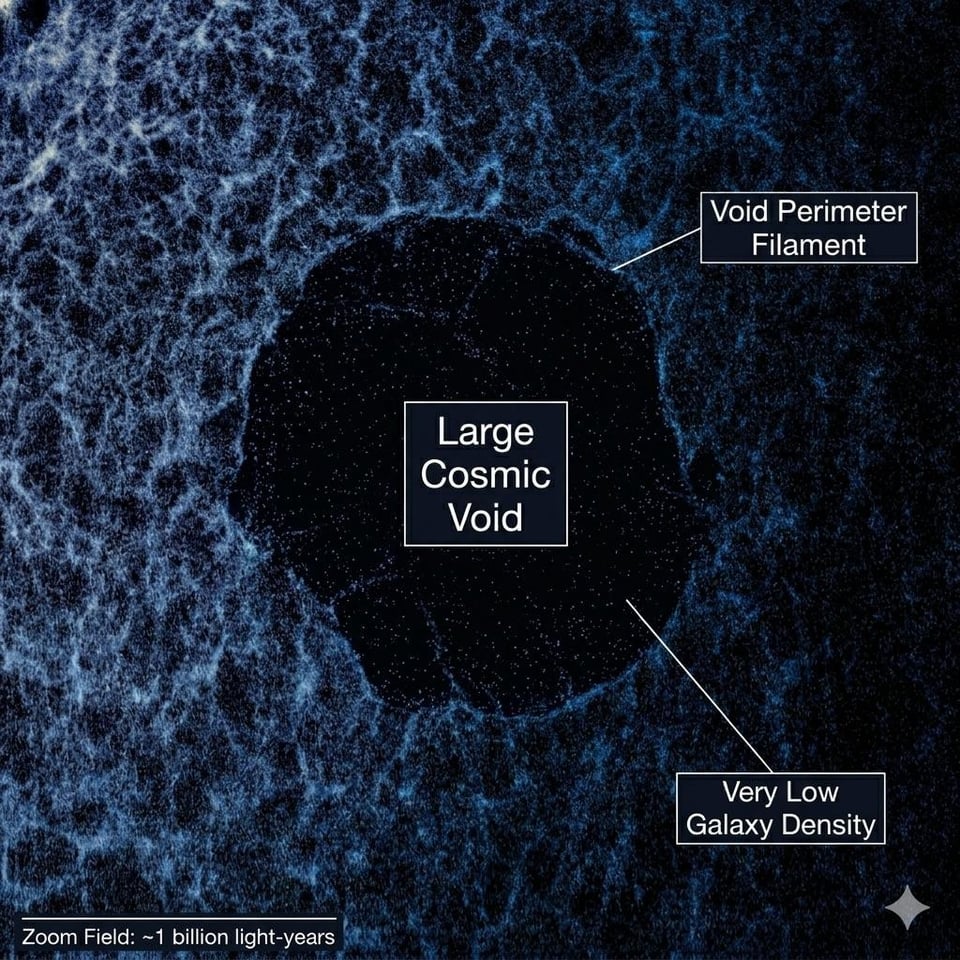
This is perhaps the most unnerving part of the map. While gravity pulls matter into dense filaments, it leaves behind unimaginably vast, spherical regions of emptiness called Cosmic Voids. This specific void spans hundreds of millions of light-years across. It isn’t perfectly empty—there are a few isolated, lonely galaxies drifting in there—but the density of matter is a fraction of what it is in the filaments.
Image 5: Distant Quasars (Zoom 3)
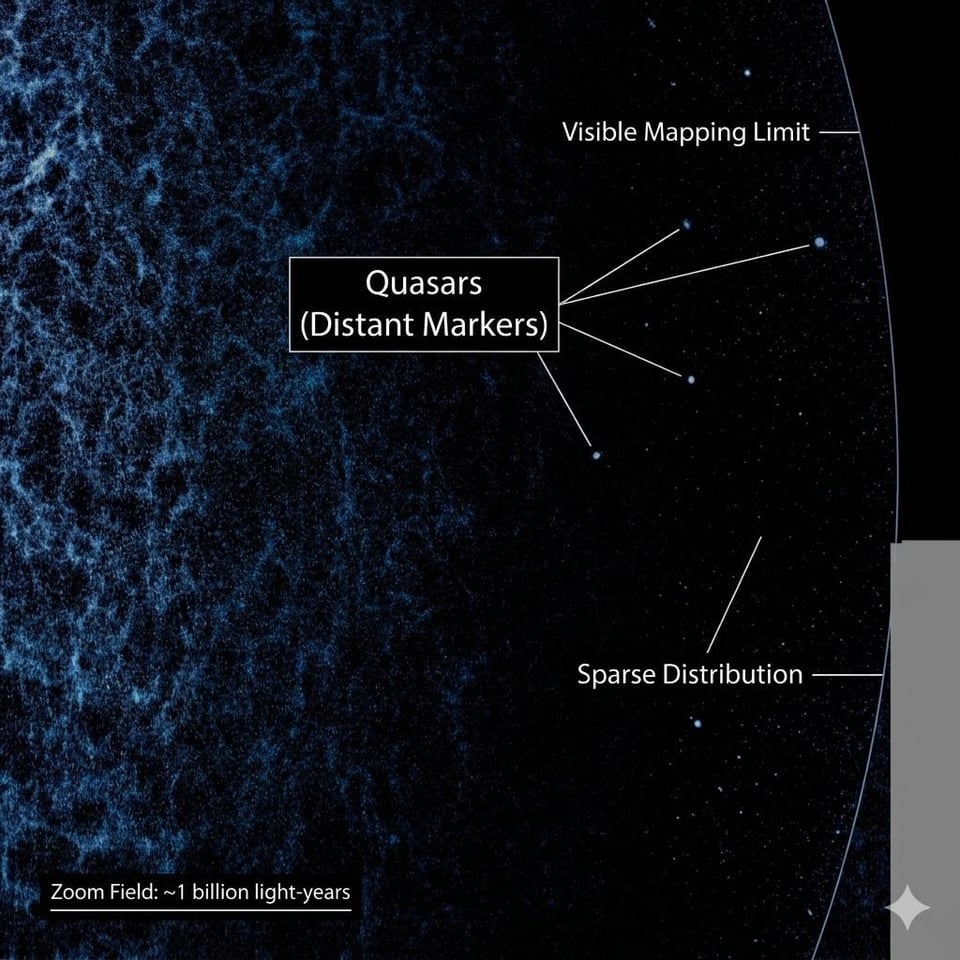
Looking at the far-right edge of the map, the web-like structure seems to fade into a sparse scattering of dots. These are Quasars—the extremely luminous, active supermassive black holes at the centers of distant galaxies. Because they are so bright, they act as cosmic lighthouses, allowing the DESI instrument to map the universe at distances where normal, fainter galaxies can no longer be seen. The light from these specific dots has been traveling toward us for the majority of the universe’s existence.
*** TL;DR: The glowing blue web isn’t gas; it’s billions of galaxies. I mapped out the Superclusters, Cosmic Voids, and Quasars to show the true scale of the new DESI map.
I’m really curious if you took 10-20 of the largest/dentist clusters and made dot replicas of that in a petri dish to grow bacteria. If that bacteria map would range something similar.
And if it did, especially remarkably similar; does that mean universal connection isn’t just a meta physical expression but a physical reality at the Grand scale through cluster lanes?
Yodas_Lil_Helper on
I wonder what this map will look like in 20 years…

![[OC] Mapping 11 billion light-years: I took the raw DESI cosmic web data and annotated the Superclusters, Voids, and Quasars to show the true scale.](https://www.byteseu.com/wp-content/uploads/2026/04/swk2cb524vvg1.jpg "[OC] Mapping 11 billion light-years: I took the raw DESI cosmic web data and annotated the Superclusters, Voids, and Quasars to show the true scale.")
4 Comments
Recently, the Dark Energy Spectroscopic Instrument (DESI) team released the largest 3D map of our universe ever created. When I first saw the raw data image, my brain immediately tried to process it as a local nebula—something like the Carina or Orion gas clouds.
But the reality of this image is much more profound.
Every single microscopic point of light you see here is not a star. It is an entire galaxy or quasar, each containing billions of stars of its own. The bright white light on the far left represents our local viewpoint on Earth. As your eyes move to the right, you are looking deeper into space, and therefore, further back in time.
I put together a few mapped versions and zoomed-in crops to help visualize the actual architecture of the cosmos we are looking at. (Swipe through the gallery to follow along!)
Image 1 & 2: The Cosmic Web Map
On a cosmological scale, gravity has pulled matter into an incredibly complex, sponge-like structure known as the “Cosmic Web.” You can clearly see how galaxies are not scattered randomly; they are strung along massive filaments of dark matter, forming the largest continuous structures in existence. The distance from the left edge to the right edge of this image is roughly 10 to 11 billion light-years.
Image 3: The Supercluster Cores (Zoom 1)
In this crop, we are looking at the heavy gravitational “city centers” of the universe. Where massive dark matter filaments intersect, galaxy clusters are drawn together to form Superclusters. These extremely dense hubs contain thousands of individual galaxies bound together by gravity. If you were standing on a planet inside one of those dense filament intersections, your night sky would be absolutely ablaze with neighboring galaxies.
Image 4: The Deep Cosmic Voids (Zoom 2)
This is perhaps the most unnerving part of the map. While gravity pulls matter into dense filaments, it leaves behind unimaginably vast, spherical regions of emptiness called Cosmic Voids. This specific void spans hundreds of millions of light-years across. It isn’t perfectly empty—there are a few isolated, lonely galaxies drifting in there—but the density of matter is a fraction of what it is in the filaments.
Image 5: Distant Quasars (Zoom 3)
Looking at the far-right edge of the map, the web-like structure seems to fade into a sparse scattering of dots. These are Quasars—the extremely luminous, active supermassive black holes at the centers of distant galaxies. Because they are so bright, they act as cosmic lighthouses, allowing the DESI instrument to map the universe at distances where normal, fainter galaxies can no longer be seen. The light from these specific dots has been traveling toward us for the majority of the universe’s existence.
*** TL;DR: The glowing blue web isn’t gas; it’s billions of galaxies. I mapped out the Superclusters, Cosmic Voids, and Quasars to show the true scale of the new DESI map.
[Link to official release!](https://newscenter.lbl.gov/2026/04/15/desi-completes-planned-3d-map-of-the-universe-and-continues-exploring/)
Tool used for visualization: Gemini Deep Research
This makes me deeply anxious
I’m really curious if you took 10-20 of the largest/dentist clusters and made dot replicas of that in a petri dish to grow bacteria. If that bacteria map would range something similar.
And if it did, especially remarkably similar; does that mean universal connection isn’t just a meta physical expression but a physical reality at the Grand scale through cluster lanes?
I wonder what this map will look like in 20 years…