
![Apartment and house sale prices per m² across EU capitals [OC]](https://www.byteseu.com/wp-content/uploads/2026/06/ffqrap95cp4h1-1024x559.png "Apartment and house sale prices per m² across EU capitals [OC]")
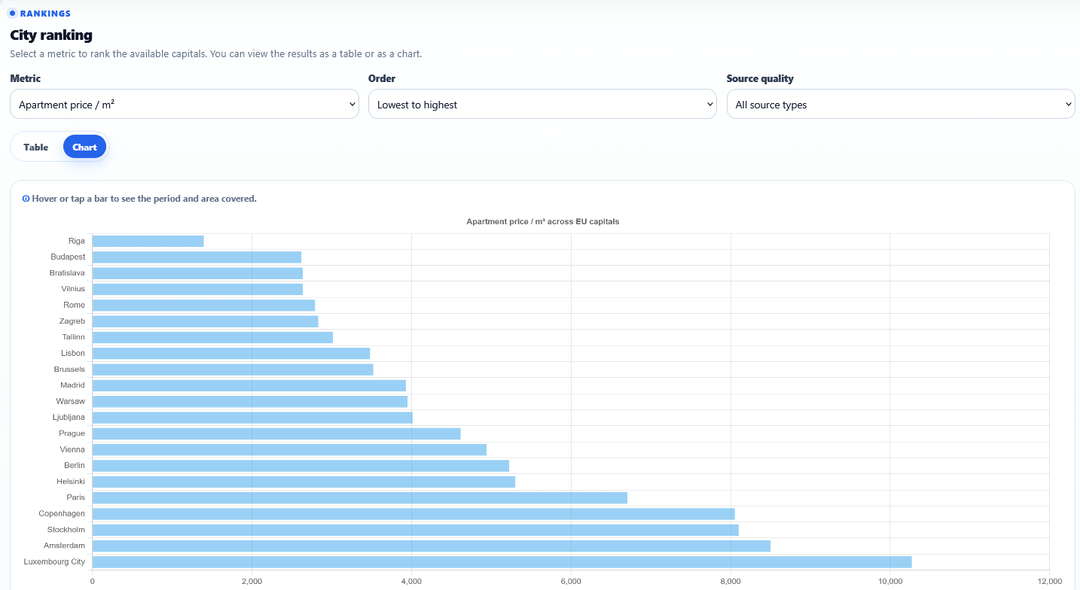
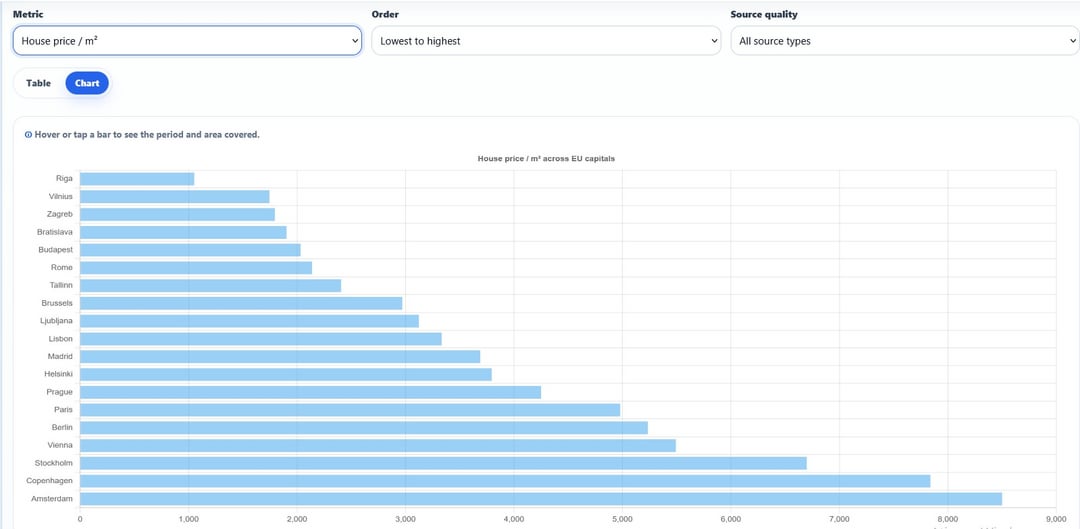
I compiled public/official data for EU capital cities and ranked apartment and house sale prices per m².
Where available, I used Eurostat data. When Eurostat did not provide a suitable city-level value, I used national, municipal, or publicly available market sources. Some values refer to wider geographies such as greater city area, municipality, or commune, depending on the source.
For Eurostat sale-price values, new dwellings include VAT where applicable, existing dwellings exclude transfer taxes, and real estate agency fees are excluded. Other sources follow their own published methodology.
The interactive version shows the period and area covered on hover/tap.
This is the initial version of the project, currently focused on EU capital cities. The site also includes rents, electricity, gas, and water comparisons.
Sources and full methodology: https://citycostatlas.com
Posted by miguelsims12
2 Comments
I’m not sute what’s included when you mention “commune”, but if it means only the city, that makes no sense to compare communes with greater area.
For paris for exemple, it would almost double the price/m if you were using only the commune
What is happening in Riga?