
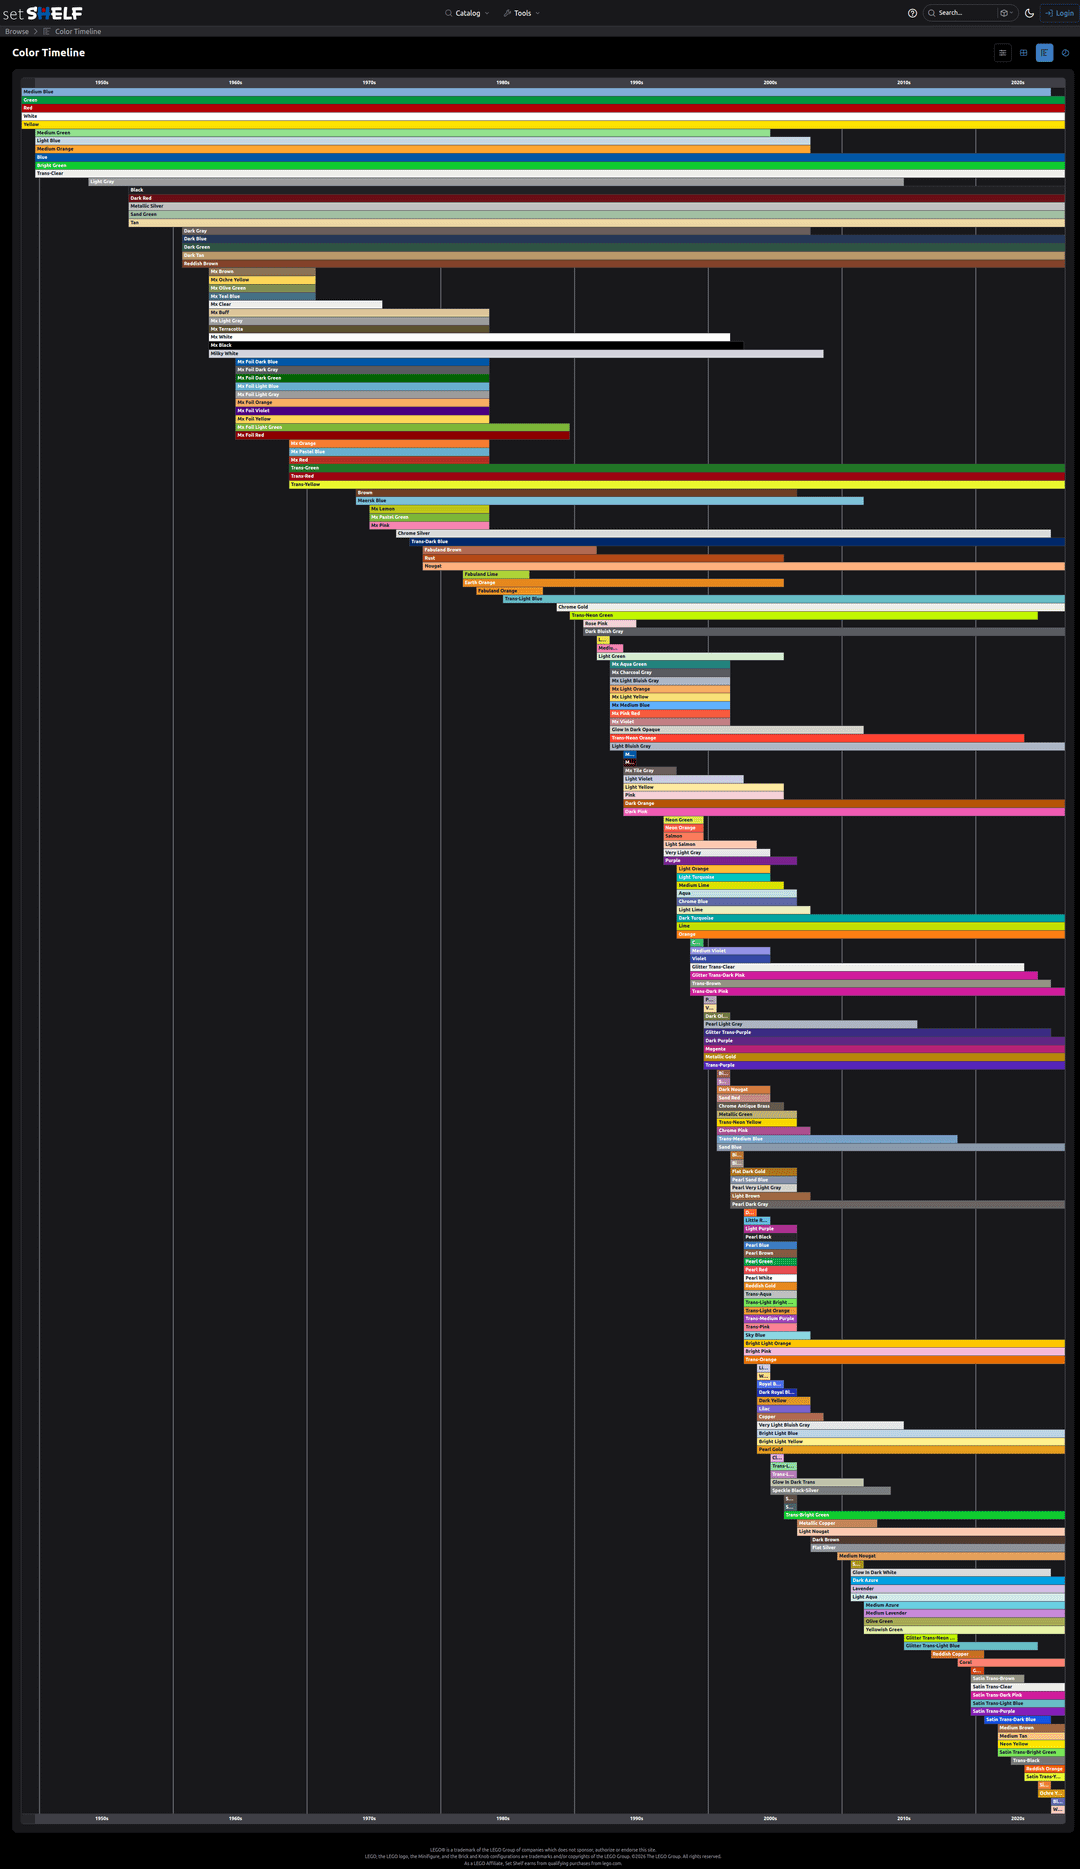
![[OC] The Evolution of LEGO Colors (1949–2026): A comprehensive historical timeline mapping when every official hue was introduced, retired, and its usage over time.](https://www.byteseu.com/wp-content/uploads/2026/06/iqvcykneaq4h1-888x1536.png "[OC] The Evolution of LEGO Colors (1949–2026): A comprehensive historical timeline mapping when every official hue was introduced, retired, and its usage over time.")
As a lifelong LEGO enthusiast, I wanted to build a interactive data visualization that tracks the complete history of LEGO's color palette. Over the decades, LEGO has expanded far beyond its basic white, red, blue, green, and yellow bricks, introducing highly specific gradients, metallic finishes, and transparent hues.
I put together a few views from the cataloging tool I built to show how this palette has evolved over time:
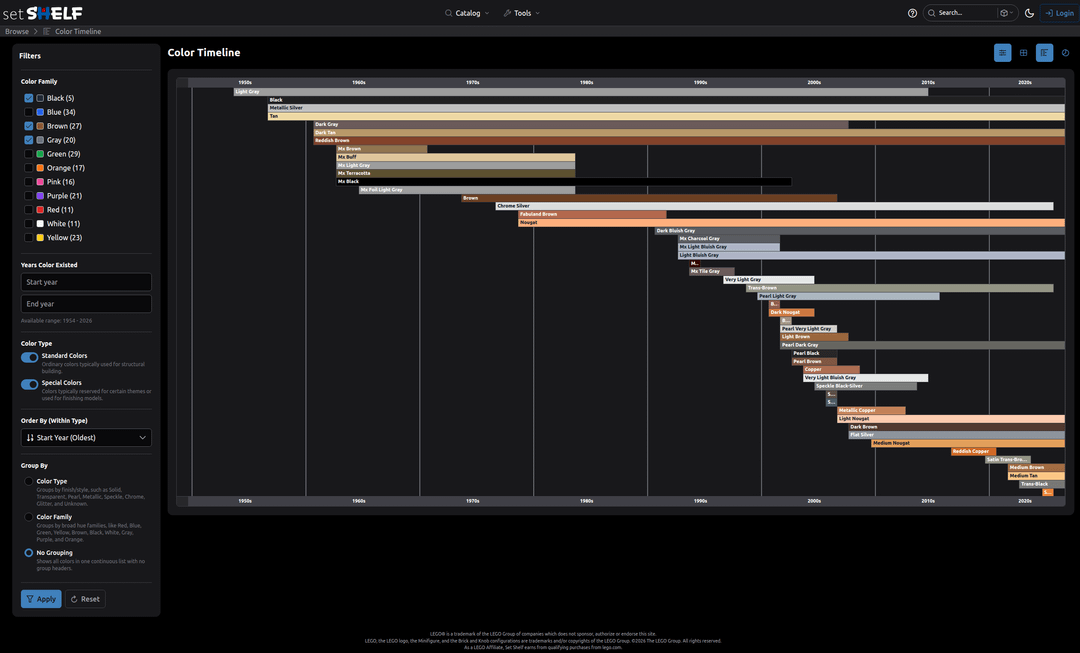
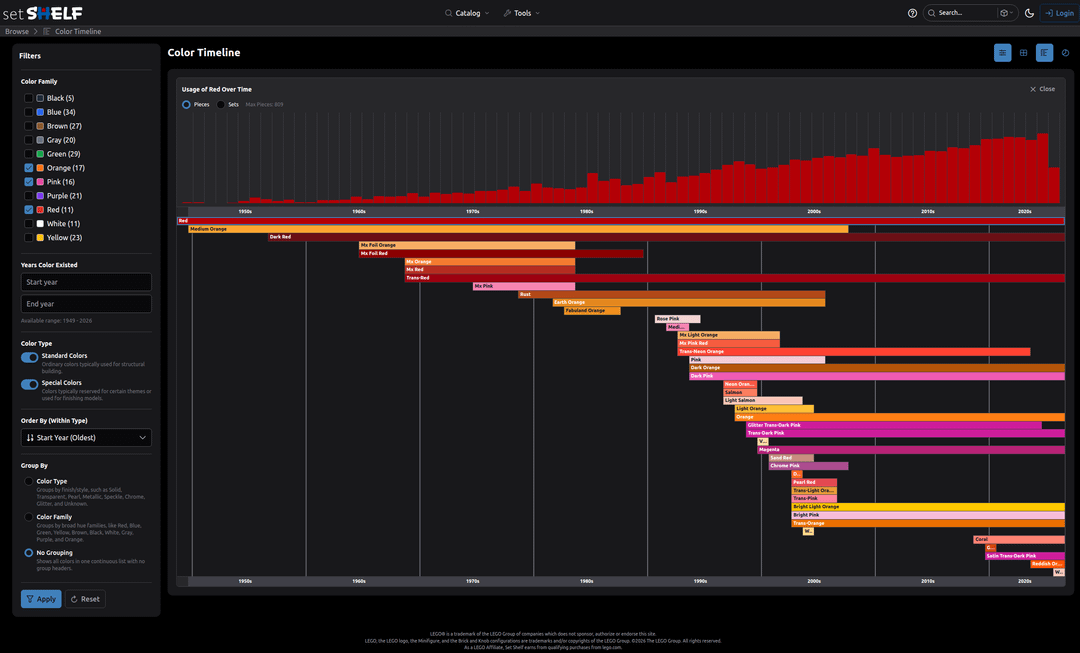
First Image: The complete macro view. This charts every single color from 1949 up to the present day, arranged by their introductory year, showcasing the massive explosion of unique hues that started in the late 1990s and early 2000s.Second Image: A filtered view focusing strictly on Earth-tones and neutrals (Black, Gray, and Brown color families). This highlights how older, foundational colors like Light Gray were eventually sunsetted and replaced by modernized variants like Light Bluish Gray in the mid-2000s.Third: A deep-dive interactive panel showing the literal "Usage Over Time" for a selected color family (in this case, Red). Clicking a hue populates an upper bar chart detailing exactly how many individual pieces or sets utilized that exact color spectrum year-by-year, charting its peak eras.
Would love to hear your thoughts on the UI/UX or any trends you notice in the historical data! I am looking for creative ways to pressent how the lego pallet has changed over time.
You can play with the visual here: https://setshelf.com/catalog/color-timeline
Posted by ExpensiveCase5543
6 Comments
**Data Source:** The historical part, set, and color catalog data is aggregated directly from official **BrickLink Catalog Downloads** ([https://www.bricklink.com/catalogDownload.asp](https://www.bricklink.com/catalogDownload.asp)), which was then cleaned, structured, and cross-referenced to ensure timeline continuity spanning from 1949 to 2026. I had to manually assign color groups, as this was not included in the bricklink data.
**Tools Used to Create the Visualization:**
* **Backend & Data Orchestration:** Java / Spring Boot managing the relational data structures and catalog parsing.
* **Frontend Framework:** Angular for structured component architecture and state management.
* **UI & Visualization Components:** PrimeNG UI suite leveraging customized, responsive layouts to handle rendering hundreds of concurrent timeline nodes smoothly.
* **Theme & Layout:** Custom dark-mode analytics presentation styled with modern CSS frameworks.
Soooo, if we talk about dark turquoise, teal, you do not show the hiatus, it had?
Would the diagrams be very different, if you only highlighted the years, a colour var seen in, perhaps? How about if a colour hasn’t shown up in a set for a couple of years?
So in fairness, some of the dead colours may return.
This IS beautiful data, OP! Can’t wait to play around with this later.
I only work in black, and sometimes very, very dark gray.
**Update:** Made a quick upgrade to the tool! You can now select multiple colors at once to see how their usage stacks up over time.
If you want a piece of pure brick history, select the old Grays alongside the modern Bluish Grays. You can perfectly map out the timeline of the great “LEGO Civil War of 2004” from when the swap first occurred.
https://preview.redd.it/7y2p5vh5zr4h1.png?width=1179&format=png&auto=webp&s=ea50feeca163b42693c1df605638b0904c4fea29
You’re telling me they JUST discontinued the first of the original 5