
![[OC] World Cup Global TV Audience: Round by Round](https://www.byteseu.com/wp-content/uploads/2026/07/ruvfx4dptyeh1-1536x1399.png "[OC] World Cup Global TV Audience: Round by Round")
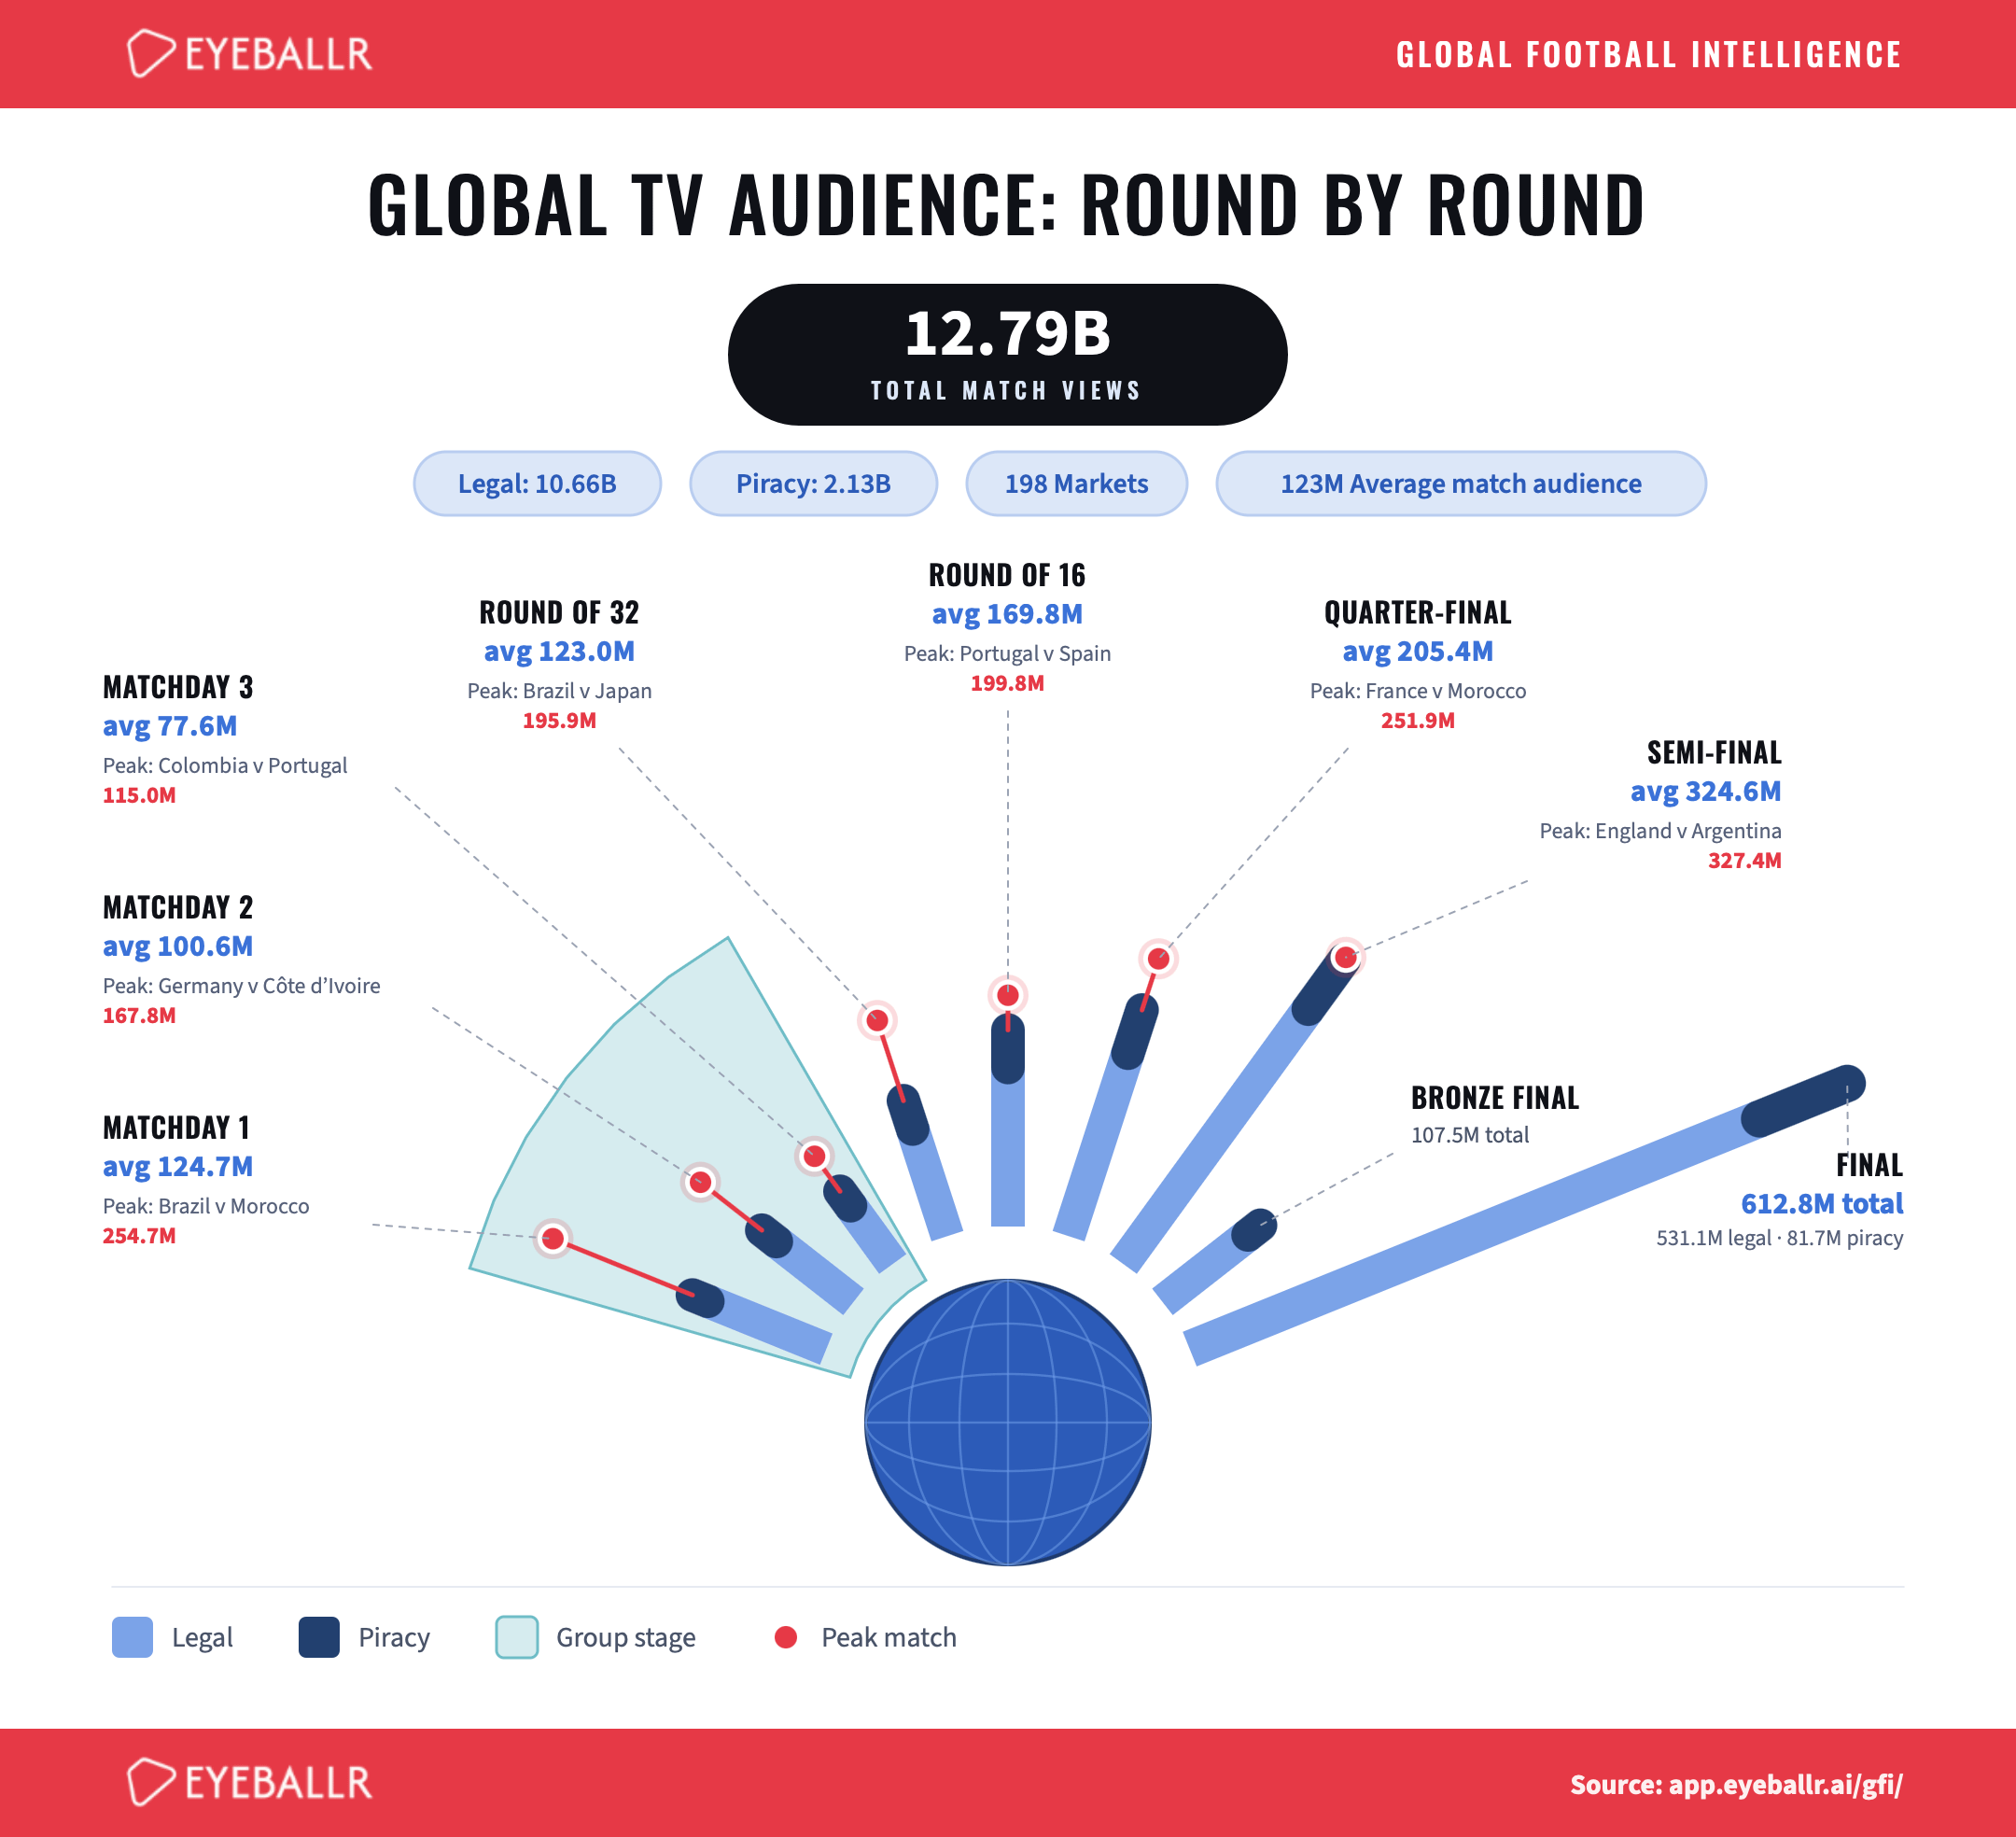
How the world really watched this tournament: 12.79B match views across 198 markets, blending legal broadcasts and piracy into one global TV viewership picture. The chart breaks down average audiences and peak games round by round, showing how attention climbs from early group matches to the knockout stages and the Final.
Data & tools: Global Viewership – round by round audiences summed across the tournament to give cumulative match views. Each figure is Eyeballr's modelled estimate of total match views, legal broadcast plus modelled piracy, including out-of-home viewing, not panel-measured or official broadcaster data.
Built with: custom SVG/JavaScript & data prepared in Python.
Source: https://unofficialpartner.substack.com/p/overheard-at-the-sportspro-investor
Posted by SJOMalley
4 Comments
Where on earth is someone going to get piracy viewing numbers from? 🤔 You would have to know all illegal stream sources in the first instance and for most of these they don’t advertise viewing numbers so you’d need server access to know. Fabricated metrics.
The most entertaining game of the tournament almost got the fewest amount of views. People didn’t know what they were missing!
I dunno, i think these numbers are far too low
No need for this bar chart to be circularly oeganized.
Also, would be interesting as a separate analysis to see whether some of the viewership numbers co-vary with the time of day it was played. I would assume games played during the night in Europe would have consistently lower numbers, but that’s just an assumption.