
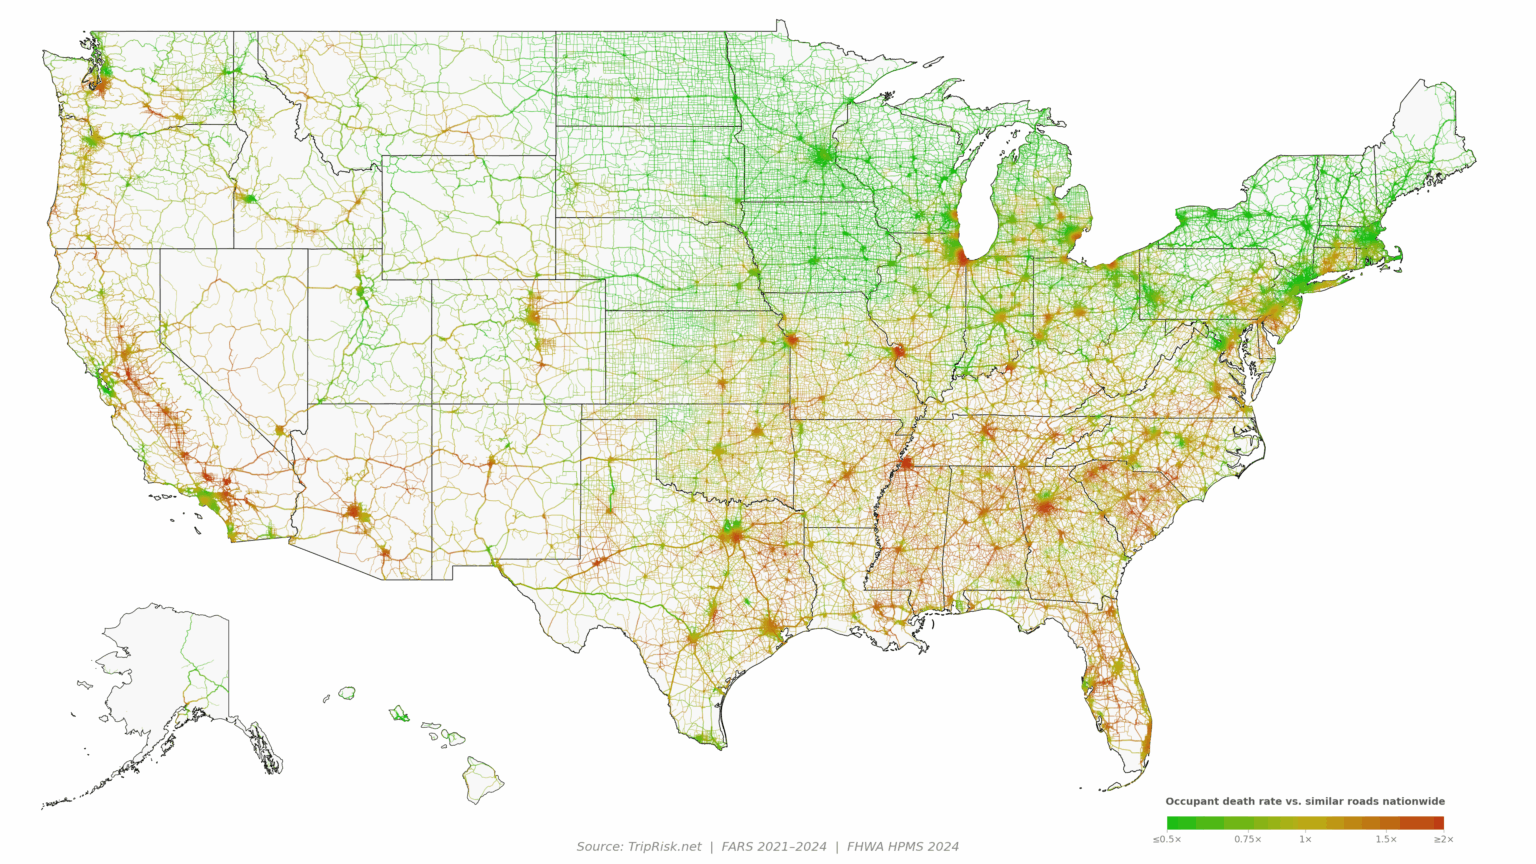

Hi-res zoomable, color-blind, and absolute-risk versions can be viewed here.
This is an updated model (with better parameters and imputation) and includes another year of data compared to the previous one.
Data are normalized by road type so similar roads are comparable.
Data were compiled using national fatal crash and volume data (FARS 2021-2024, HPMS). Only FHWA functional classes 1-6 are shown (local roads are excluded to make a cleaner visual).
Posted by jejmcjej
30 Comments
you can see wealth distribution in so many metros
I’m here for the comments.
What is going on with that chunk of 82 between Yakima and Prosser …
Edit: wow something is definitely wrong with area … That is a lot of fatal crashes.
[https://wtsc.wa.gov/dashboards/fatal-crash-map/](https://wtsc.wa.gov/dashboards/fatal-crash-map/)
US 99 in the CA Central Valley, oof.
I’ve done a lot of driving and this map confirms my anecdotal experiences with Memphis, TN and i70 through Missouri.
A question on your methodology. Obviously you don’t have deaths on every mile of every road, did you grid deaths and then smooth these to adjacent roads? For example, in Chicago would deaths from accidents on interstate 94 be applied to the surrounding arterial roads?
The shown image seems quite deceptive. The absolute risk map looks more accurate. At the very least, it needs to be normalized by vehicle-miles traveled. This should clearly show rural roads as being the most dangerous compared with city roads..
I-40 between Flagstaff and Albuquerque being so dangerous despite how much less traffic there is than most of these routes really says something.
it’s surprising so many metros have high death rates because I heard proximity to hospitals is a big factor in survival (like gun violence)
Yet another map that says Minnesota is awesome.
For being the state with the most alcohol consumption, Wisconsin is impressively green.
Memphis does NOT surprise me at all. North Dallas through is interestingly low risk compared to the rest of the city.
What is going on with Memphis?
lol, you’re borked as soon as you get off the highway in the Inland Empire
https://preview.redd.it/jd990wuq9iwh1.jpeg?width=1179&format=pjpg&auto=webp&s=676baedab6a8e2663a8a02122886c1b5e0ae5465
What’s going on in Connecticut vs Boston and New York?
Pittsburgh is a significant outlier of being safe through the whole city without the whole state being safe. Anyone know why?
I am perplexed by New Orleans – LA is the craziest place to drive I have ever lived.
(gotta go to the high res map for it to even really show up)
huh, I guess it’s just a different kind of accident in NOLA. That place really is different.
out of town is much more “high velocity bad decisions.” In town is much more…. pot holes/watter filled bottomless pits, drivers stopping and backing up/outright going the wrong way, people randomly in the road… etc. oh, saw a gator on the interstate once. Probably a daily occurrence and I just didn’t pay attention.
This is very interesting! Do you have a diff map between years? I’d be really interested to know how much this varies year-to-year.
in seattle metro area, I-90 divides red-green clearly. North of I-90 is green and south is red.
Beautiful illustration but normalized to what?
Thanks for this interesting and useful data visualization!
One factor I’m curious about is hospital distance and quality, and how much that matters. It might be interesting to have a hospital overlay and/or data set normalized to hospital distance.
What are some other factors that you might decouple if you wanted to expand this project?
So the ones who drink the most have the safest rides? What are you guys doing in the south? Meth?
You can see elevated crash rates along the I-5 corridor in California’s Central Valley – this is partially attributable to the region’s susceptability to a weather phenomenon called [tule fog!](https://en.wikipedia.org/wiki/Tule_fog)
https://preview.redd.it/qfhupv8kgiwh1.png?width=500&format=png&auto=webp&s=34da7defbe4cc9a8244127b81fd1ca7899daacad
Massachusetts is green? But it’s full of Masshole drivers!
What does occupant death rate mean?
Deaths per hour? Deaths per mile? Or other?
Apparently stupid is worse than drunk
At first I thought it was funny that the Bay Area (Cali) was so green, but then I realized that with all the traffic they are probably going 5mph and it’s not that dangerous. 😂
One caution: normalizing by FHWA road class doesn’t necessarily make roads comparable: roads in the same class can differ significantly in design, traffic, and risk. You’ll introduce some variation, probably most notably across state boundaries.
Bible Belt never fails to be disappointing.
East Texas and DFW are just vehicular combat.