US stock market returns (1872 to 2024) — the less you look, the more you win [OC]
Posted by getToTheChopin

![US stock market returns (1872 to 2024) -- the less you look, the more you win [OC]](https://www.byteseu.com/wp-content/uploads/2025/01/oqjrhg0ojrae1-1024x837.gif "US stock market returns (1872 to 2024) — the less you look, the more you win [OC]")
US stock market returns (1872 to 2024) — the less you look, the more you win [OC]
Posted by getToTheChopin
4 Comments
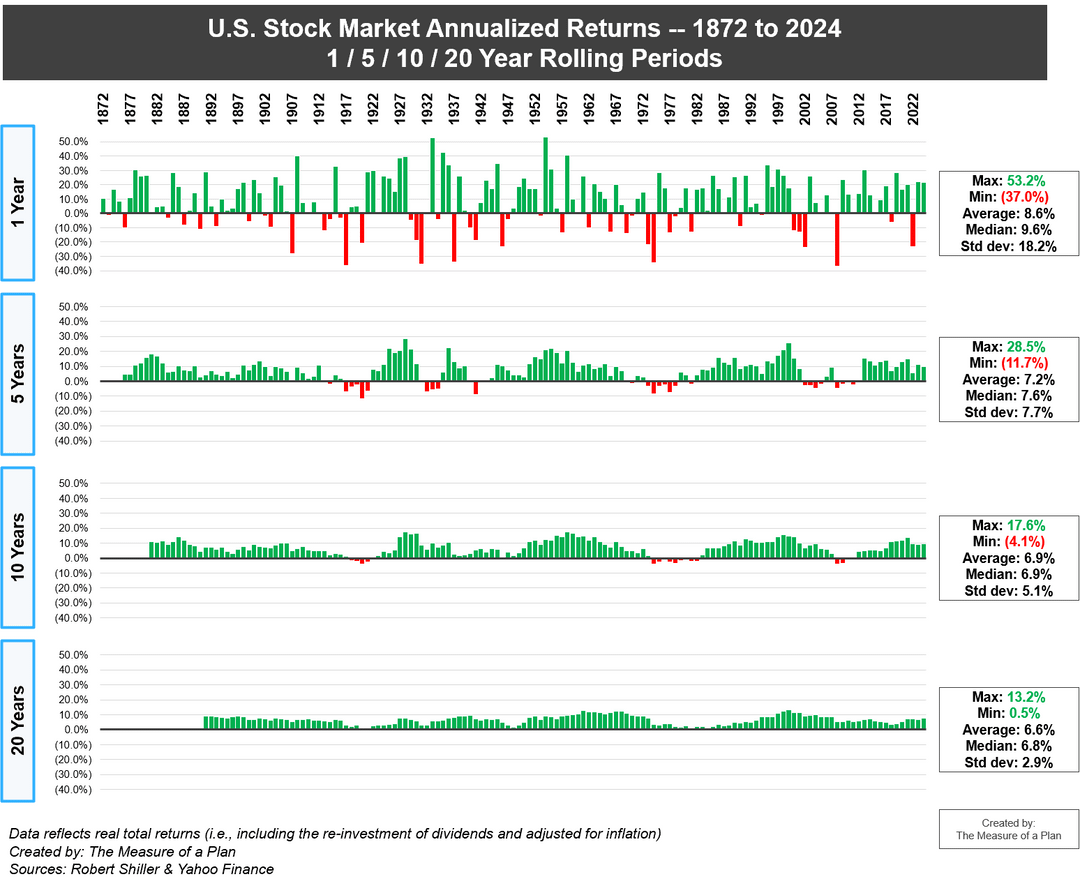
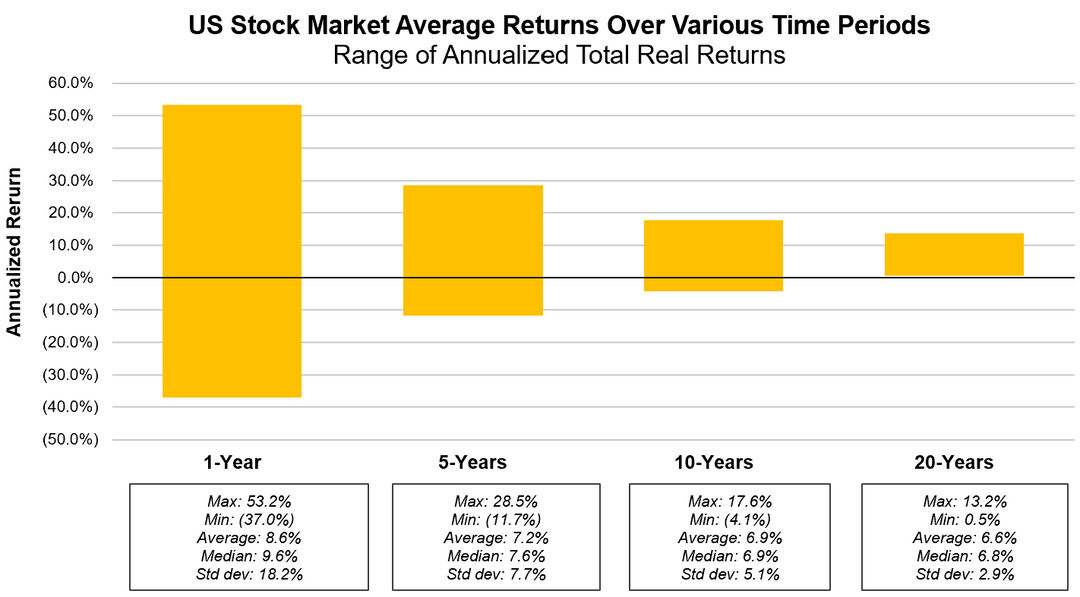
All charts and analysis: [https://themeasureofaplan.com/us-stock-market-returns-1870s-to-present/](https://themeasureofaplan.com/us-stock-market-returns-1870s-to-present/)
Key insights:
* Simple Average: the average return of the U.S. stock market has been 8.6% per year over the past ~150 years (1872 to 2024)
* Annualized Average: the return of the U.S. stock market has been 7.1% per year on an annualized average basis, over the past ~150 years
* The market has grown in 69% of all years, and declined in 31% of all years on record
* While the range of returns across 1-year periods has varied significantly (from negative 37.0% to +53.2%), the annualized returns across 20-year periods have a much tighter range (from +0.5% to +13.2%)
* The U.S. stock market has never declined over any 20-year period in history
Tools used: excel, powerpoint
Data sources: Robert Shiller dataset, Yahoo Finance
the less you look, the more you win
ELI5? Does that mean the longer the time period, the more the…?
Are the values adjusted by inflation?
An average return of 0.5% per year over 20 years is pretty scary to think about. I get that it’s a worst case outcome, but still. Cool chart though!