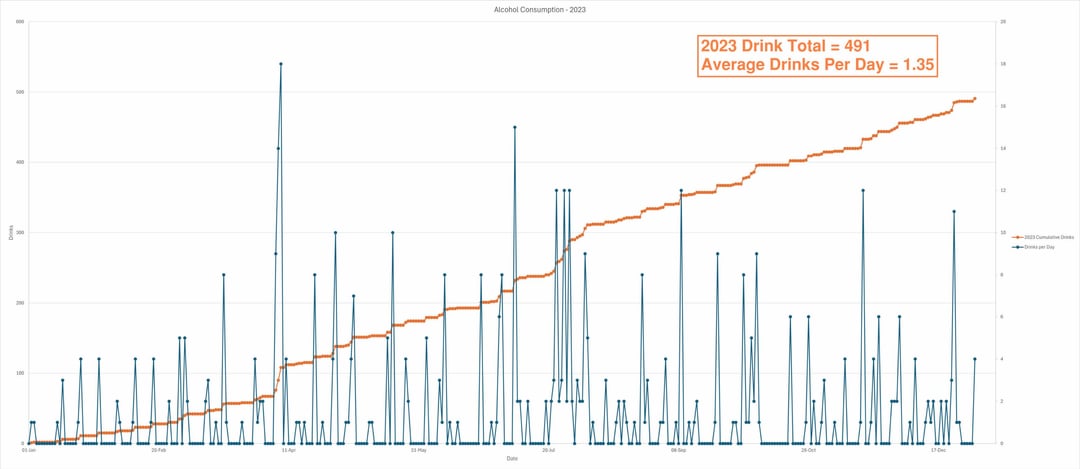
Data was collected and tracked using the iPhone notes app throughout drinking events (not the best choice but got lazy and kept on with it). Drinks were tracked as per the [CDC US Standard Drink Size](https://www.cdc.gov/alcohol/standard-drink-sizes/index.html). In general I wanted to track this behaviour in an attempt to reduce my casual and binge drinking. Thus far I have failed but will attempt to reduce my consumption in 2025.
harpies-bizarre on
If you haven’t looked into it yet, r/stopdrinking is a great resource!
CPNZ on
520 drinks one day in April? Not sure I understand the data…
VossC2H6O on
Oh this is cumulative drinks throughout the year…. I thought this was total drinks a day at a glance.
Idiotechnicality on
End of July was a wild time for ya, eh?
nosdie74 on
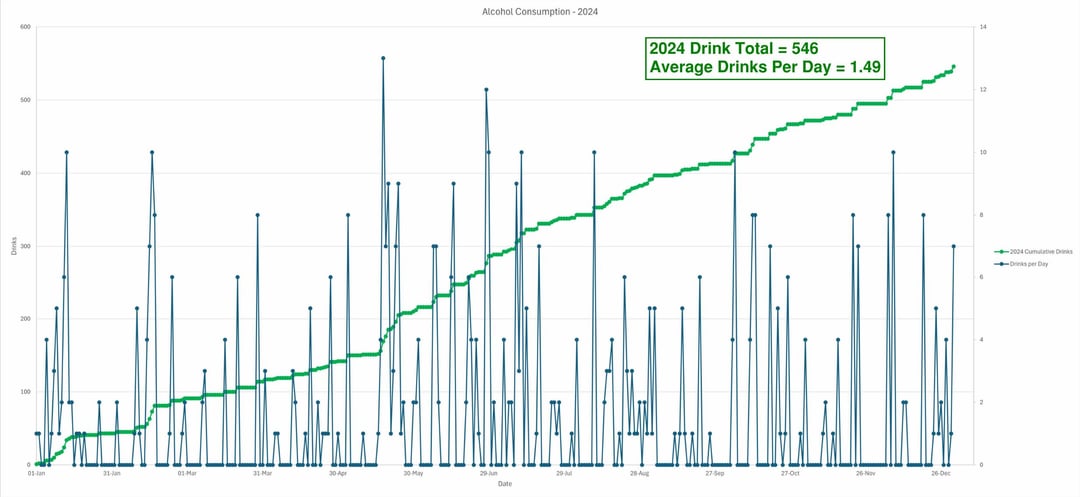
So you got married and began drinking 😂
Ship_Ship_8 on
You should flip flop the two y axis. Took me forever to figure out how you were having 300 drinks in a day
TripleSecretSquirrel on
Interesting data.
It’s surprising to me that you have quite a of days with zero drinks. Maybe an easy place to start is to shoot for more days with zero drinks! Total up the number of zero drink days from the previous two years and set a goal for more of those days, then break it down by month and week. I know for me that would be easier to tackle, knowing that to reach my goal, I need to have four days every week with zero drinks, or whatever your number is.
For what it’s worth, r/stopdrinking is always touted as a great resource, even if you’re just trying to cut back and not quit entirely.
bilgerat78 on
I think you should try to drink less
roaming_art on
Numbers are going up, gotta be a good thing right!?
metdear on
This is a strange presentation of the data. Maybe an overlay of bars by day would help.
DDough505 on
After some rigorous statistical analysis, I believe the data suggest you’re a heavy binge drinker.
Along with drinks per day, you should also include drinks per drinking day. That would exclude all the non drink days and really highlight your binge drinking.
steelmanfallacy on
What does an 18-drink day look like? Does that start at dawn and involve a drink per hour or is it 5 drinks an hour until blackout? Or something else?
antariusz on
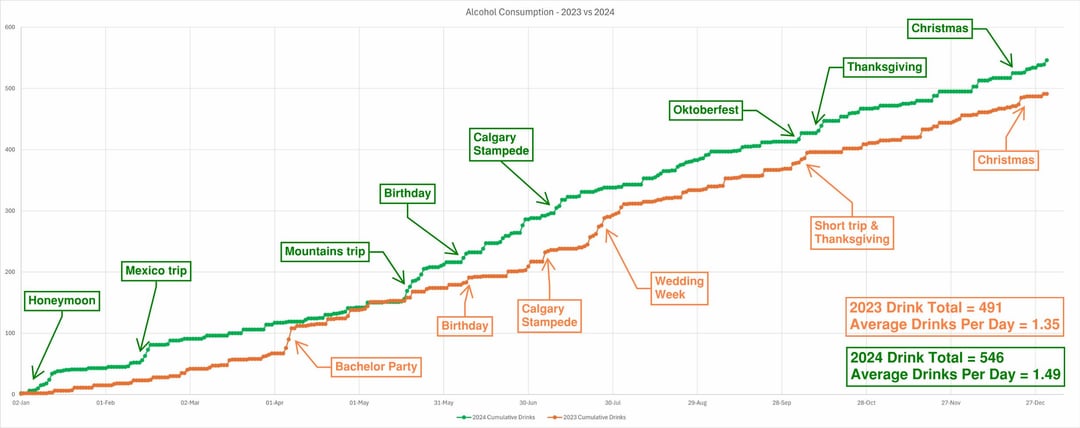
Not sure what the point of showing the different holidays was, you were going to be drinking regardless of the holiday or not.
tank1780 on
You gotta pump those numbers up.
Nick_Hammer96 on
So is this alcoholic levels or no?
Biberundbaum on
You might not realize it, but you are an Alcoholic.
NottheIRS1 on
This is interesting, but it is NOT beautiful.
ketosoy on
I initially thought the orange line was drinks per day and wondered how your year got so progressively sloppy
throwawaycanadian2 on
A better way to show this would be to completely remove the cumilitive part, then group the dates into a much longer period, maybe by month, that would make it WAY more clear what you are showing here.
Oshester on
Good luck. That’s about 50 times more than me
*Smoke weed everydayyy*
nathan555 on
if you puked the next morning would the line go down
mttpgn on
Most people drink more on weekends and less on weeknights. Since it’s already unclear which day of the spikes fall on anyway, the changes in your drinking habits through the year would be better represented if you smoothed the data to show number of drinks per week.
kulta_panda on
That bachelor party and “mountain trip” got a bit crazy, eh? 😂
Fit_Understanding666 on
OP must be under 30. If I do this at 40 I would be thoroughly incapacitated 💀
Squeaky_sun on
Just skip that crazy mountains trip and 2023 and 2024 are about the same.
picklelonious on
What’s the average cost of a drink?
Siliatra on
A moving average would’ve been nice to see
maxdacat on
Thank you for your service
Englishfucker on
Just a reminder to everyone that no amount of alcohol consumption is healthy

![My Alcohol Consumption - January 2023 to December 2024 [OC]](https://www.byteseu.com/wp-content/uploads/2025/01/qqdm1vns01ce1-1024x445.jpg "My Alcohol Consumption – January 2023 to December 2024 [OC]")
30 Comments
Data was collected and tracked using the iPhone notes app throughout drinking events (not the best choice but got lazy and kept on with it). Drinks were tracked as per the [CDC US Standard Drink Size](https://www.cdc.gov/alcohol/standard-drink-sizes/index.html). In general I wanted to track this behaviour in an attempt to reduce my casual and binge drinking. Thus far I have failed but will attempt to reduce my consumption in 2025.
If you haven’t looked into it yet, r/stopdrinking is a great resource!
520 drinks one day in April? Not sure I understand the data…
Oh this is cumulative drinks throughout the year…. I thought this was total drinks a day at a glance.
End of July was a wild time for ya, eh?
So you got married and began drinking 😂
You should flip flop the two y axis. Took me forever to figure out how you were having 300 drinks in a day
Interesting data.
It’s surprising to me that you have quite a of days with zero drinks. Maybe an easy place to start is to shoot for more days with zero drinks! Total up the number of zero drink days from the previous two years and set a goal for more of those days, then break it down by month and week. I know for me that would be easier to tackle, knowing that to reach my goal, I need to have four days every week with zero drinks, or whatever your number is.
For what it’s worth, r/stopdrinking is always touted as a great resource, even if you’re just trying to cut back and not quit entirely.
I think you should try to drink less
Numbers are going up, gotta be a good thing right!?
This is a strange presentation of the data. Maybe an overlay of bars by day would help.
After some rigorous statistical analysis, I believe the data suggest you’re a heavy binge drinker.
Along with drinks per day, you should also include drinks per drinking day. That would exclude all the non drink days and really highlight your binge drinking.
What does an 18-drink day look like? Does that start at dawn and involve a drink per hour or is it 5 drinks an hour until blackout? Or something else?
Not sure what the point of showing the different holidays was, you were going to be drinking regardless of the holiday or not.
You gotta pump those numbers up.
So is this alcoholic levels or no?
You might not realize it, but you are an Alcoholic.
This is interesting, but it is NOT beautiful.
I initially thought the orange line was drinks per day and wondered how your year got so progressively sloppy
A better way to show this would be to completely remove the cumilitive part, then group the dates into a much longer period, maybe by month, that would make it WAY more clear what you are showing here.
Good luck. That’s about 50 times more than me
*Smoke weed everydayyy*
if you puked the next morning would the line go down
Most people drink more on weekends and less on weeknights. Since it’s already unclear which day of the spikes fall on anyway, the changes in your drinking habits through the year would be better represented if you smoothed the data to show number of drinks per week.
That bachelor party and “mountain trip” got a bit crazy, eh? 😂
OP must be under 30. If I do this at 40 I would be thoroughly incapacitated 💀
Just skip that crazy mountains trip and 2023 and 2024 are about the same.
What’s the average cost of a drink?
A moving average would’ve been nice to see
Thank you for your service
Just a reminder to everyone that no amount of alcohol consumption is healthy