
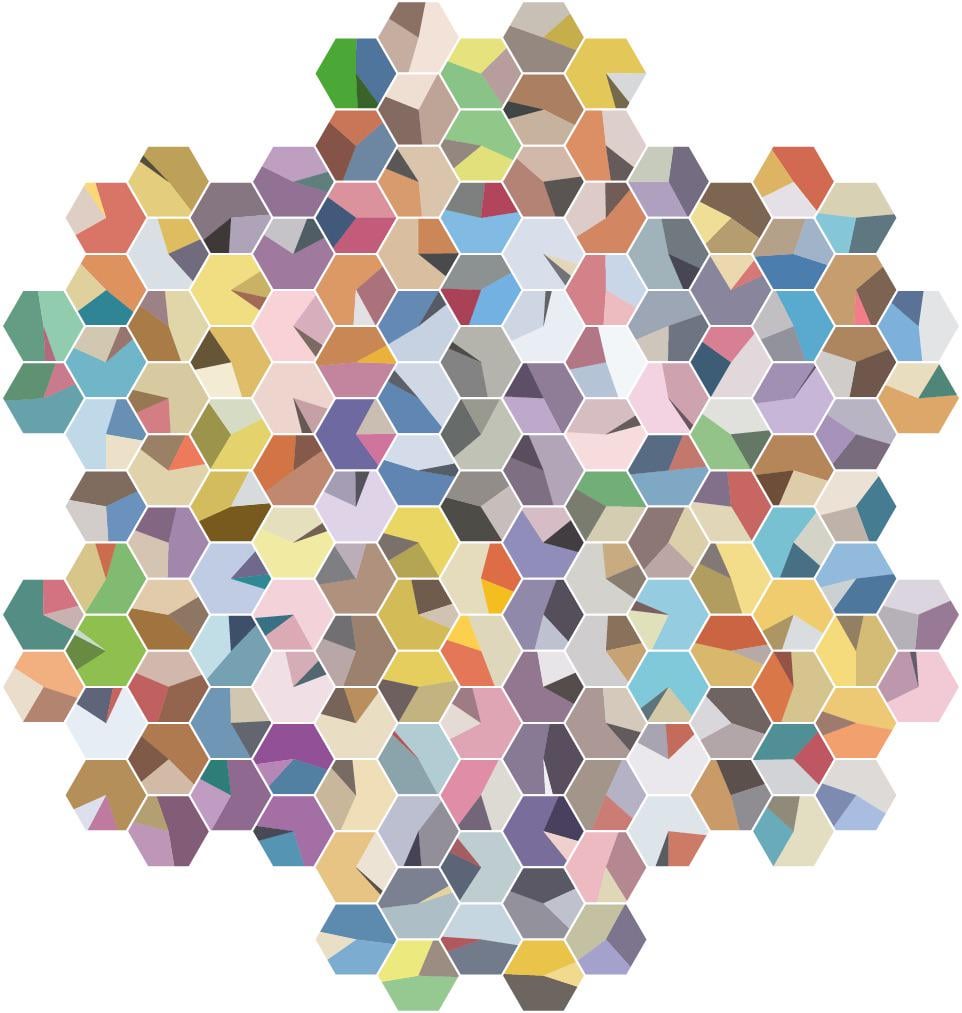
This is a collection of 151 hexagonal pie charts arranged in columns, top to bottom, left to right, representing the proportions of the top 3 dominant colors of each of the original 151 Pokémon.
* I began with the official Sugimori art found on the veekun archive
* I stripped out transparent backgrounds and “dark colors”, computed by transforming RGB to Adobe Luma
* I converted RGB to CIE LAB, a “perceptually uniform” color space, so that Euclidean distance would correspond to human perceptual color difference
* I ran k-means clustering with 3 clusters and extracted the cluster centers, then associated each pixel back to a cluster to get proportional weights
* I used an SVG library to manually draw each pie chart alongside mathematics for rotations, trigonometry, hexagonal geometry, clip paths, randomizing the starting angle of the pie chart, a coordinate system, etc.
* Figuring out a nice way of representing 151 hexagons was the most manual part; I ended up settling on a hexagonal grid of size 8 with 169 hexagons, which means I only had to remove 18 = 6 x 3 = 3 per side. I removed the corners, and then removed 2 more from each side in a symmetric way, and ended up with this snowflake pattern
It’s interesting to see clusters of 2-3 similarly colored hexagons representing the evolutions, as well as to compare to the original images to see what the algorithm picked up.
I’ll link a GitHub with these methods in a general purpose Python library if people are interested.
Posted by rijuvenator
9 Comments
Beautiful! Great work. Love that you shared the procedure 🙂
That is really visually … great. This data is indeed beautiful.
Original 151… Tell me you are over 30 without saying it.
This could make a cool quilt.
Dope. Are they in order, and if so where does it start? Upper-ish left? If I squint I can convince myself I see bulba/char/squirt evolutions.
Hey! I’m working on a color picking program right now and I’ve been looking at k means clustering as a way to pull the top 3 or 5 colors from an image. Do you feel that k means clustering merged some colors with such a small k value?
I’ve been going back and forth on how to best select my k value to get the true dominant colors rather than a mesh of two or three combined.
I love the project! I’d be super interested to look at the github project.
The whole grid represents MissingNo.
Finally a fucking submission that qualifies for this subs title.
Great job!!
Just to make fully sure I complied with the rules of this sub:
* The original data source is the Sugimori art from the veekun archive [[link](https://veekun.com/dex/downloads)]
* I used Python with several libraries, including Pillow, svg.py, numpy, pandas, scikit-learn, and scikit-image
* Here is the GitHub with the code I wrote with installation instructions and explanations of the parameters [[link](https://github.com/rijuvenator/pokemon-colors)]