**How many people work for the federal government?**
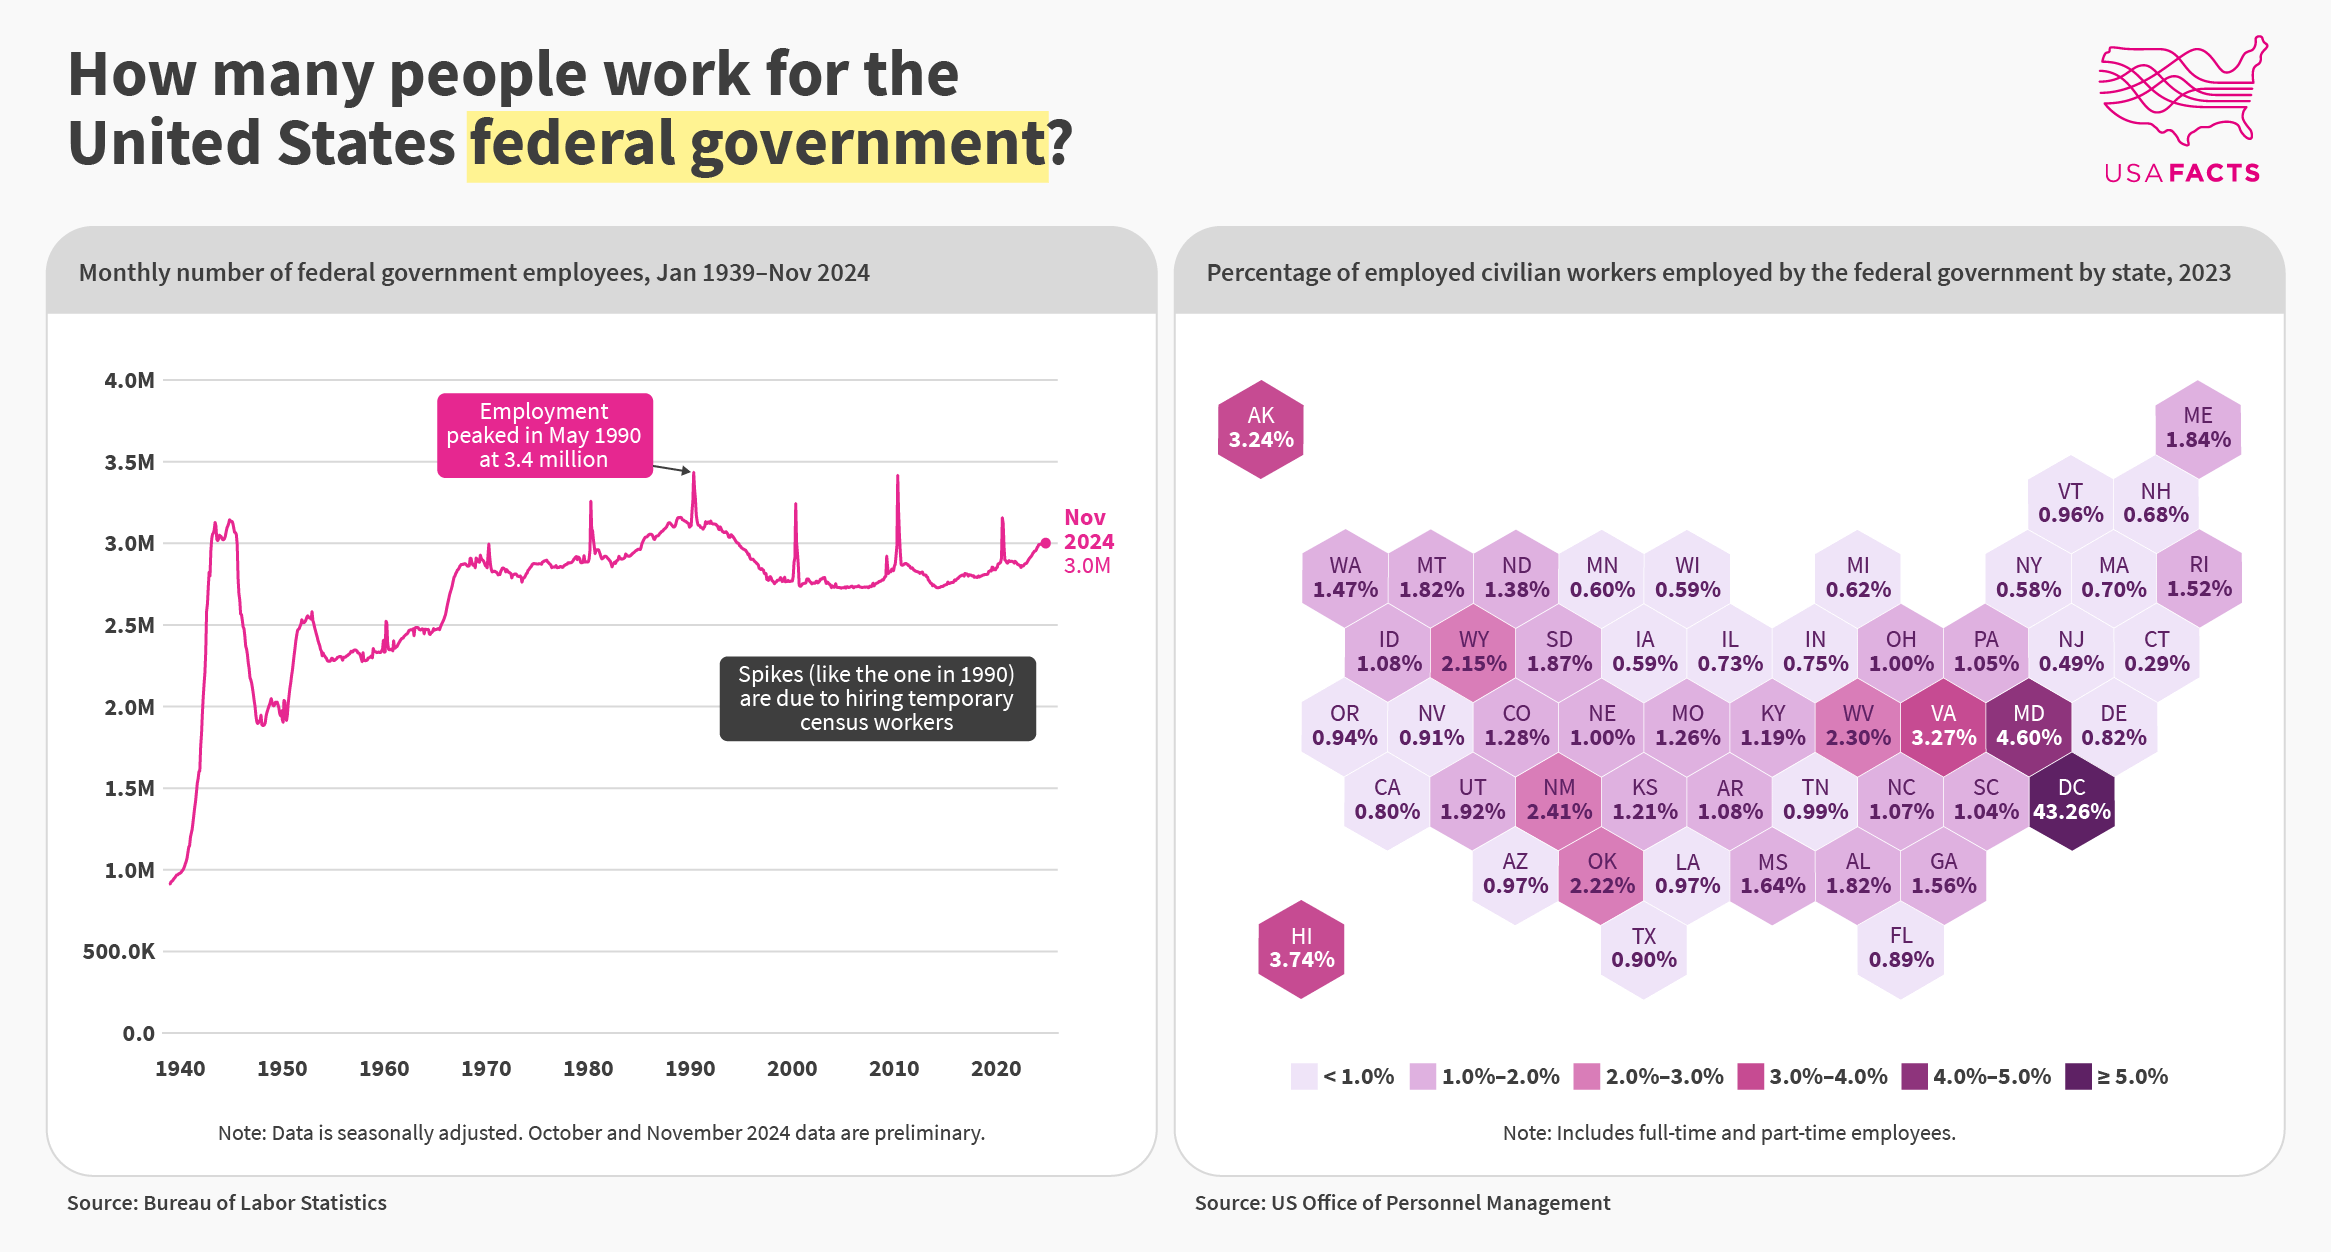
As of November 2024, the federal government employed just over 3 million people, making it the nation’s 15th largest workforce.
When data tracking began in 1939, the federal workforce was less than one million. It tripled in size over the next five years. By early 1948, employment had scaled back again by nearly 40%, to 1.88 million.
Federal employment continued to grow throughout the 20th century, topping out with 3.4 million employees in 1990, then contracting to 2.8 million in 1999. During the 2000s, it remained relatively flat.
Spikes in employment (like the one in 1990) are due to the once-a-decade census, when the government hires temporary workers to conduct the survey; during the 2020 census the number of federal employees increased from 2.9 million in January to 3.2 million in August. By December 2020, the count returned to 2.9 million.
**Where do these folks work?**
Most federal employees are in California (147,487), Virginia (144,483), and Maryland (142,876). Federal employees represent 0.8%, 3.3%, and 4.6% of these states’ total workforces.
High federal employment numbers in Virginia and Maryland are due to their proximity to Washington, DC. In Virginia, the Navy (31.4%), Department of Defense (19.5%), and Army (10.5%) employed the most people. In Maryland, Department of Health and Human Services (28.1%), the Navy (12.0%), and the Army (10.6%) led the way.
As of March 2024, 26.4% of California federal employees worked for the Department of Veterans Affairs and 23.5% worked for the Navy. The remaining 50.1% worked for other agencies.
Washington, DC, has the highest number of federal employees (162,144) representing 43.3% of the District’s workforce.
**Where do these folks work (by department)?**
Department|Total employment
———-|—————-
Defense – Military |775100
Veterans Affairs|433700
Homeland Security |212000
Justice |114600
Treasury |98700
Agriculture |88000
Health and Human Services|81300
Interior |63000
Social Security Administration|58800
Transportation |54200
Commerce |41300
State |29900
Corps of Engineers – Civil Works|24900
National Aeronautics and Space Administration|17800
Energy |15700
Labor |15700
Environmental Protection Agency|15000
General Services Administration|12300
Tennessee Valley Authority|10900
Housing and Urban Development|8400
Small Business Administration|6500
International Assistance Programs|6400
Federal Deposit Insurance Corporation|6300
Securities and Exchange Commission|4700
Smithsonian Institution|4700
Education |4100
Nuclear Regulatory Commission|2800
National Archives and Records Administration|2700
Office of Personnel Management|2700
Equal Employment Opportunity Commission|2200
Bureau of Consumer Financial Protection |1700
US Agency for Global Media|1600
Federal Communications Commission |1500
National Science Foundation|1500
Federal Trade Commission|1200
National Credit Union Administration|1200
National Labor Relations Board|1200
Other Defense – Civil Programs |1000
At last count, roughly 5,600 canines found themselves in the employ of the United States federal government. Most work for the Department of Homeland Security (2,943), followed by the Department of Defense (1,808), the Department of State (204), and the Department of Agriculture (148).
JackfruitCrazy51 on
Just heard an interesting podcast, which is kind of tied to this data. It’s the Odd Lots(Bloomberg) podcast and is called “Why Government hiring is so Inefficient.”. Warning, you may want to commit an act of violence after hearing the hiring process.
SheetDangSpit on
The US population has more than doubled over the timeline in this chart. This chart seems to show that we have a lower percentage of the population working for the federal government than any time since WWII.
thestereo300 on
So DOGE wants to cut 1-2 trillion of a budget of 6-7 million.
That’s a lot of jobs. If they did what they said (doubt) it would impact the unemployment rate significantly I would think right?
K7Sniper on
Why are there large spikes every 10 years?
At first I thought they were coinciding with election years, but not every 10 year is one.
jojjy91 on
I love your profile and your data graphics! Simple e easy to understand
zimm25 on
What’s up with CT? We pay out far more in federal taxes than we get back. I’m assuming this doesn’t count defense contracts which would significantly increase the number but maybe not.
Aromatic_Rip_3328 on
I heard a discussion of this on NPR this week, and having worked in federal contracting in the DC area, felt this ignored the trend since the 1980s to hire government service contractors for many agencies. You go into a government agency office and probably 7 out of 10 people working there are contractors, not GS positions. The GS positions are in general managers and assistant managers. In many cases those positions are “hereditary” in that they are filled by relatives of much more senior managers in the same or related agencies
ErMahGeerd on
What program did you visualise this in ?
jwrig on
It is too bad that they don’t list contractors which last time I checked outnumbered federal employees.
pthomas745 on
Paul Krugman wrote about how many are employed by various Federal and State Governments recently. With pictures and descriptions, etc.
Matt Stoller, in his series of posts about monopoly and general “waste”, finds the biggest issue of all: fraud in bid rigging. And, the role of giants like McKinsey, a huge contractor. Most of what Rethuglicans go on and on about isn’t about protecting anyone except…large corporations slurping at the government trough.
The federal budget in 2024 was 6.752 trillion. If there are 3 million federal employees, this suggests we spend an average of $2.25 million per employee. If you assume an average compensation of $100k per employee, this leaves $2.15 million per employee.
Punchline: the federal budget is staggering and unsustainable but don’t think that firing federal employees will move the needle much.

![How many people work for the US federal government? [OC]](https://www.byteseu.com/wp-content/uploads/2025/01/zq9q09xciede1-1536x825.png "How many people work for the US federal government? [OC]")
17 Comments
Sources: Bureau of Labor Statistics, Office of Personnel Management
Tools: Datawrapper, Illustrator
More data [here](https://usafacts.org/articles/how-many-people-work-for-the-federal-government/)
Just under 1 percent? Neat
This doesn’t include government contractors, it would be much bigger.
That’s impressively stable since 1970, census peaks aside. Shows you what a lot of waffle goes around on the subject of excess government employees
Here are some excerpts from [our report](https://usafacts.org/articles/how-many-people-work-for-the-federal-government/) to save you a click (not that you were going to click, but still).
**How many people work for the federal government?**
As of November 2024, the federal government employed just over 3 million people, making it the nation’s 15th largest workforce.
When data tracking began in 1939, the federal workforce was less than one million. It tripled in size over the next five years. By early 1948, employment had scaled back again by nearly 40%, to 1.88 million.
Federal employment continued to grow throughout the 20th century, topping out with 3.4 million employees in 1990, then contracting to 2.8 million in 1999. During the 2000s, it remained relatively flat.
Spikes in employment (like the one in 1990) are due to the once-a-decade census, when the government hires temporary workers to conduct the survey; during the 2020 census the number of federal employees increased from 2.9 million in January to 3.2 million in August. By December 2020, the count returned to 2.9 million.
**Where do these folks work?**
Most federal employees are in California (147,487), Virginia (144,483), and Maryland (142,876). Federal employees represent 0.8%, 3.3%, and 4.6% of these states’ total workforces.
High federal employment numbers in Virginia and Maryland are due to their proximity to Washington, DC. In Virginia, the Navy (31.4%), Department of Defense (19.5%), and Army (10.5%) employed the most people. In Maryland, Department of Health and Human Services (28.1%), the Navy (12.0%), and the Army (10.6%) led the way.
As of March 2024, 26.4% of California federal employees worked for the Department of Veterans Affairs and 23.5% worked for the Navy. The remaining 50.1% worked for other agencies.
Washington, DC, has the highest number of federal employees (162,144) representing 43.3% of the District’s workforce.
**Where do these folks work (by department)?**
Department|Total employment
———-|—————-
Defense – Military |775100
Veterans Affairs|433700
Homeland Security |212000
Justice |114600
Treasury |98700
Agriculture |88000
Health and Human Services|81300
Interior |63000
Social Security Administration|58800
Transportation |54200
Commerce |41300
State |29900
Corps of Engineers – Civil Works|24900
National Aeronautics and Space Administration|17800
Energy |15700
Labor |15700
Environmental Protection Agency|15000
General Services Administration|12300
Tennessee Valley Authority|10900
Housing and Urban Development|8400
Small Business Administration|6500
International Assistance Programs|6400
Federal Deposit Insurance Corporation|6300
Securities and Exchange Commission|4700
Smithsonian Institution|4700
Education |4100
Nuclear Regulatory Commission|2800
National Archives and Records Administration|2700
Office of Personnel Management|2700
Equal Employment Opportunity Commission|2200
Bureau of Consumer Financial Protection |1700
US Agency for Global Media|1600
Federal Communications Commission |1500
National Science Foundation|1500
Federal Trade Commission|1200
National Credit Union Administration|1200
National Labor Relations Board|1200
Other Defense – Civil Programs |1000
Unfortunately, this data does not include the number of dogs that work for the government. I apologize for that oversight, but luckily there is [data on that](https://usafacts.org/articles/dogs-with-jobs-data-on-canine-employment-in-the-government/) too.
At last count, roughly 5,600 canines found themselves in the employ of the United States federal government. Most work for the Department of Homeland Security (2,943), followed by the Department of Defense (1,808), the Department of State (204), and the Department of Agriculture (148).
Just heard an interesting podcast, which is kind of tied to this data. It’s the Odd Lots(Bloomberg) podcast and is called “Why Government hiring is so Inefficient.”. Warning, you may want to commit an act of violence after hearing the hiring process.
The US population has more than doubled over the timeline in this chart. This chart seems to show that we have a lower percentage of the population working for the federal government than any time since WWII.
So DOGE wants to cut 1-2 trillion of a budget of 6-7 million.
That’s a lot of jobs. If they did what they said (doubt) it would impact the unemployment rate significantly I would think right?
Why are there large spikes every 10 years?
At first I thought they were coinciding with election years, but not every 10 year is one.
I love your profile and your data graphics! Simple e easy to understand
What’s up with CT? We pay out far more in federal taxes than we get back. I’m assuming this doesn’t count defense contracts which would significantly increase the number but maybe not.
I heard a discussion of this on NPR this week, and having worked in federal contracting in the DC area, felt this ignored the trend since the 1980s to hire government service contractors for many agencies. You go into a government agency office and probably 7 out of 10 people working there are contractors, not GS positions. The GS positions are in general managers and assistant managers. In many cases those positions are “hereditary” in that they are filled by relatives of much more senior managers in the same or related agencies
What program did you visualise this in ?
It is too bad that they don’t list contractors which last time I checked outnumbered federal employees.
Paul Krugman wrote about how many are employed by various Federal and State Governments recently. With pictures and descriptions, etc.
[https://paulkrugman.substack.com/p/the-fraudulence-of-waste-fraud-and](https://paulkrugman.substack.com/p/the-fraudulence-of-waste-fraud-and)
Matt Stoller, in his series of posts about monopoly and general “waste”, finds the biggest issue of all: fraud in bid rigging. And, the role of giants like McKinsey, a huge contractor. Most of what Rethuglicans go on and on about isn’t about protecting anyone except…large corporations slurping at the government trough.
[https://www.thebignewsletter.com/p/cutting-government-is-easy-if-you?utm_source=post-email-title&publication_id=11524&post_id=152913281&utm_campaign=email-post-title&isFreemail=true&r=2hkjg&triedRedirect=true&utm_medium=email](https://www.thebignewsletter.com/p/cutting-government-is-easy-if-you?utm_source=post-email-title&publication_id=11524&post_id=152913281&utm_campaign=email-post-title&isFreemail=true&r=2hkjg&triedRedirect=true&utm_medium=email)
The federal budget in 2024 was 6.752 trillion. If there are 3 million federal employees, this suggests we spend an average of $2.25 million per employee. If you assume an average compensation of $100k per employee, this leaves $2.15 million per employee.
Punchline: the federal budget is staggering and unsustainable but don’t think that firing federal employees will move the needle much.