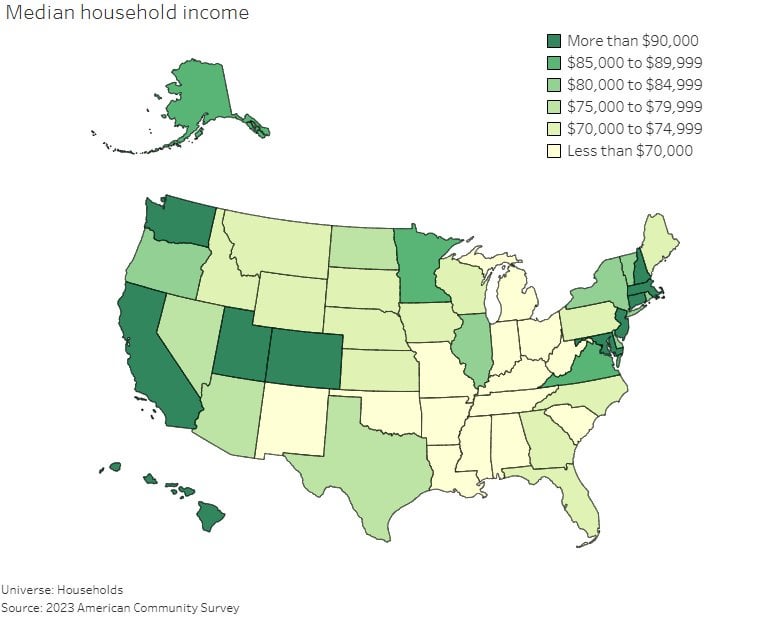
Most of the data in this visualization comes from the US Census Bureau’s 2023 American Community Survey 1-year estimates. The election data for 2020 is from the FEC and I created the visualization in Tableau.
Let me know if there are any data points you think I should add!
MonsterFonster on
Not if the Yankees keep moving down here and making everything expensive 😭

2 Comments
Most of the data in this visualization comes from the US Census Bureau’s 2023 American Community Survey 1-year estimates. The election data for 2020 is from the FEC and I created the visualization in Tableau.
Let me know if there are any data points you think I should add!
Not if the Yankees keep moving down here and making everything expensive 😭