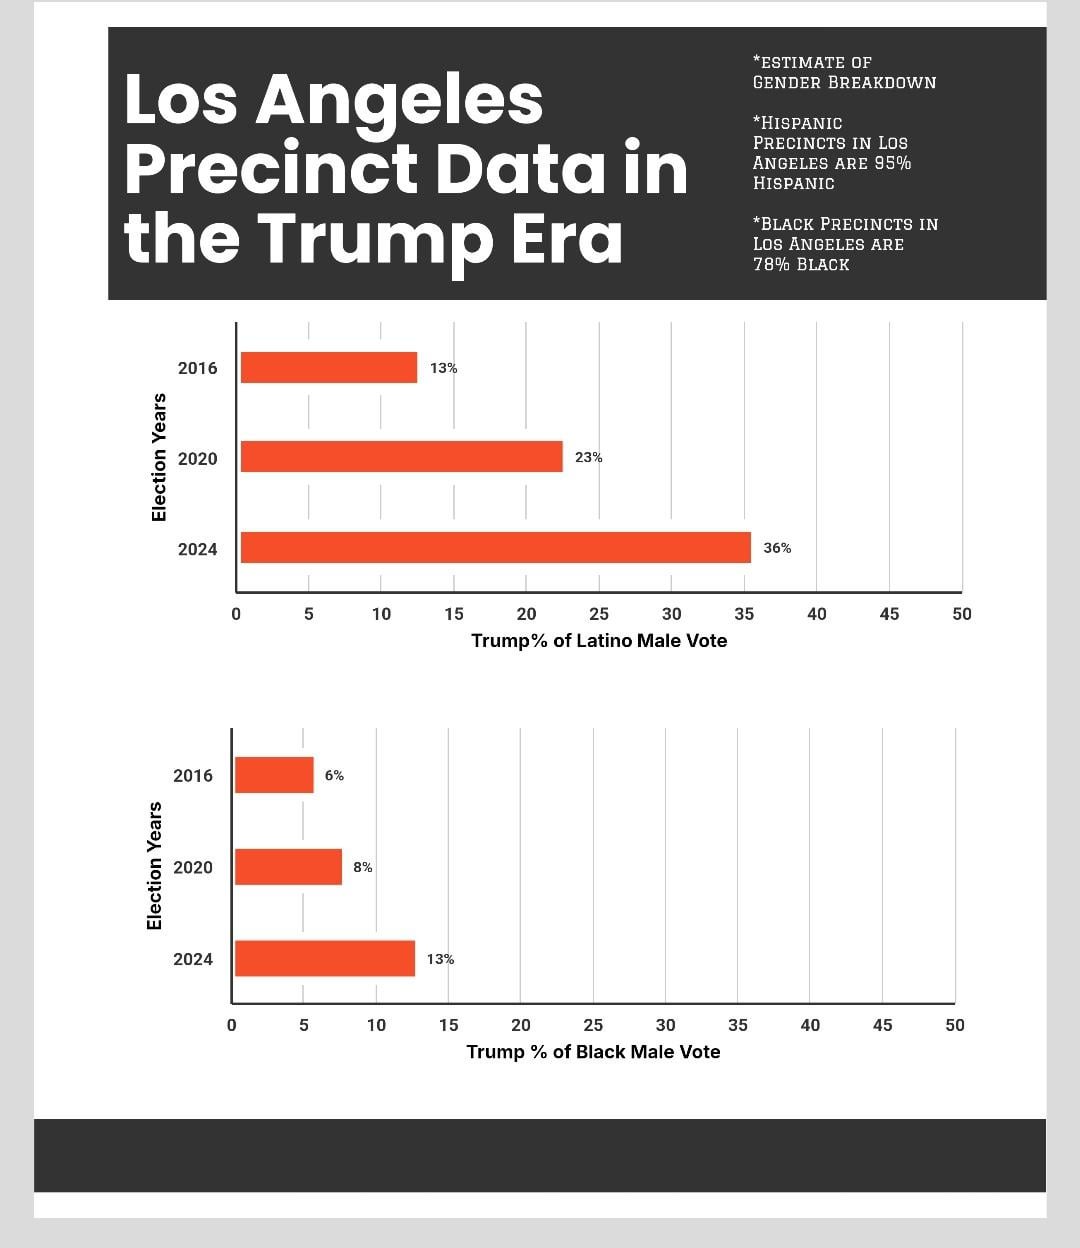
Latino Male support for Trump in Los Angeles has risen a whopping 23% since 2016.
In comparison Black Male support for Trump in Los Angeles has risen 7% since 2016.
Posted by Troy19999

![[OC] Los Angeles precinct data of Male POC every election](https://www.byteseu.com/wp-content/uploads/2025/01/wjby7swu4oee1-886x1024.jpeg "[OC] Los Angeles precinct data of Male POC every election")
Latino Male support for Trump in Los Angeles has risen a whopping 23% since 2016.
In comparison Black Male support for Trump in Los Angeles has risen 7% since 2016.
Posted by Troy19999
3 Comments
People were complaining about the quality of my charts, so I hope this is bearable.
Chart was created with – https://venngage.com/blog/infographics-maker?utm_source=google&utm_medium=cpc&utm_campaign=&utm_content=&utm_term=&match=&campaignid=21735739398&adgroupid=&gad_source=1&gclid=Cj0KCQiAy8K8BhCZARIsAKJ8sfSzZ9ys2QQK4xlAQoc8Mu0LSyw204GGq2lf0GWtOSoNQ_lUyjEbcrMaAk8sEALw_wcB
Precinct data extracted with –
https://davesredistricting.org/
So if we marry the data, and correct for population size of african americans and latinos, the story is: in these communities Trump lost by 50 percentage point in his best showing (the most recent).
No, the rate of change between 13% and 36% is not 23%. That’s not how rates work.