As of September 2024, the US national debt is $34.3 trillion. This is 4% higher than in September 2023 and up 27% from 2019, before the COVID-19 pandemic.
Per-person debt (dividing the total debt by the US population) has increased at an average rate of 5% per year since 2001. As of 2023 (the most recent population data) the federal debt was equivalent to $102,000 per person.
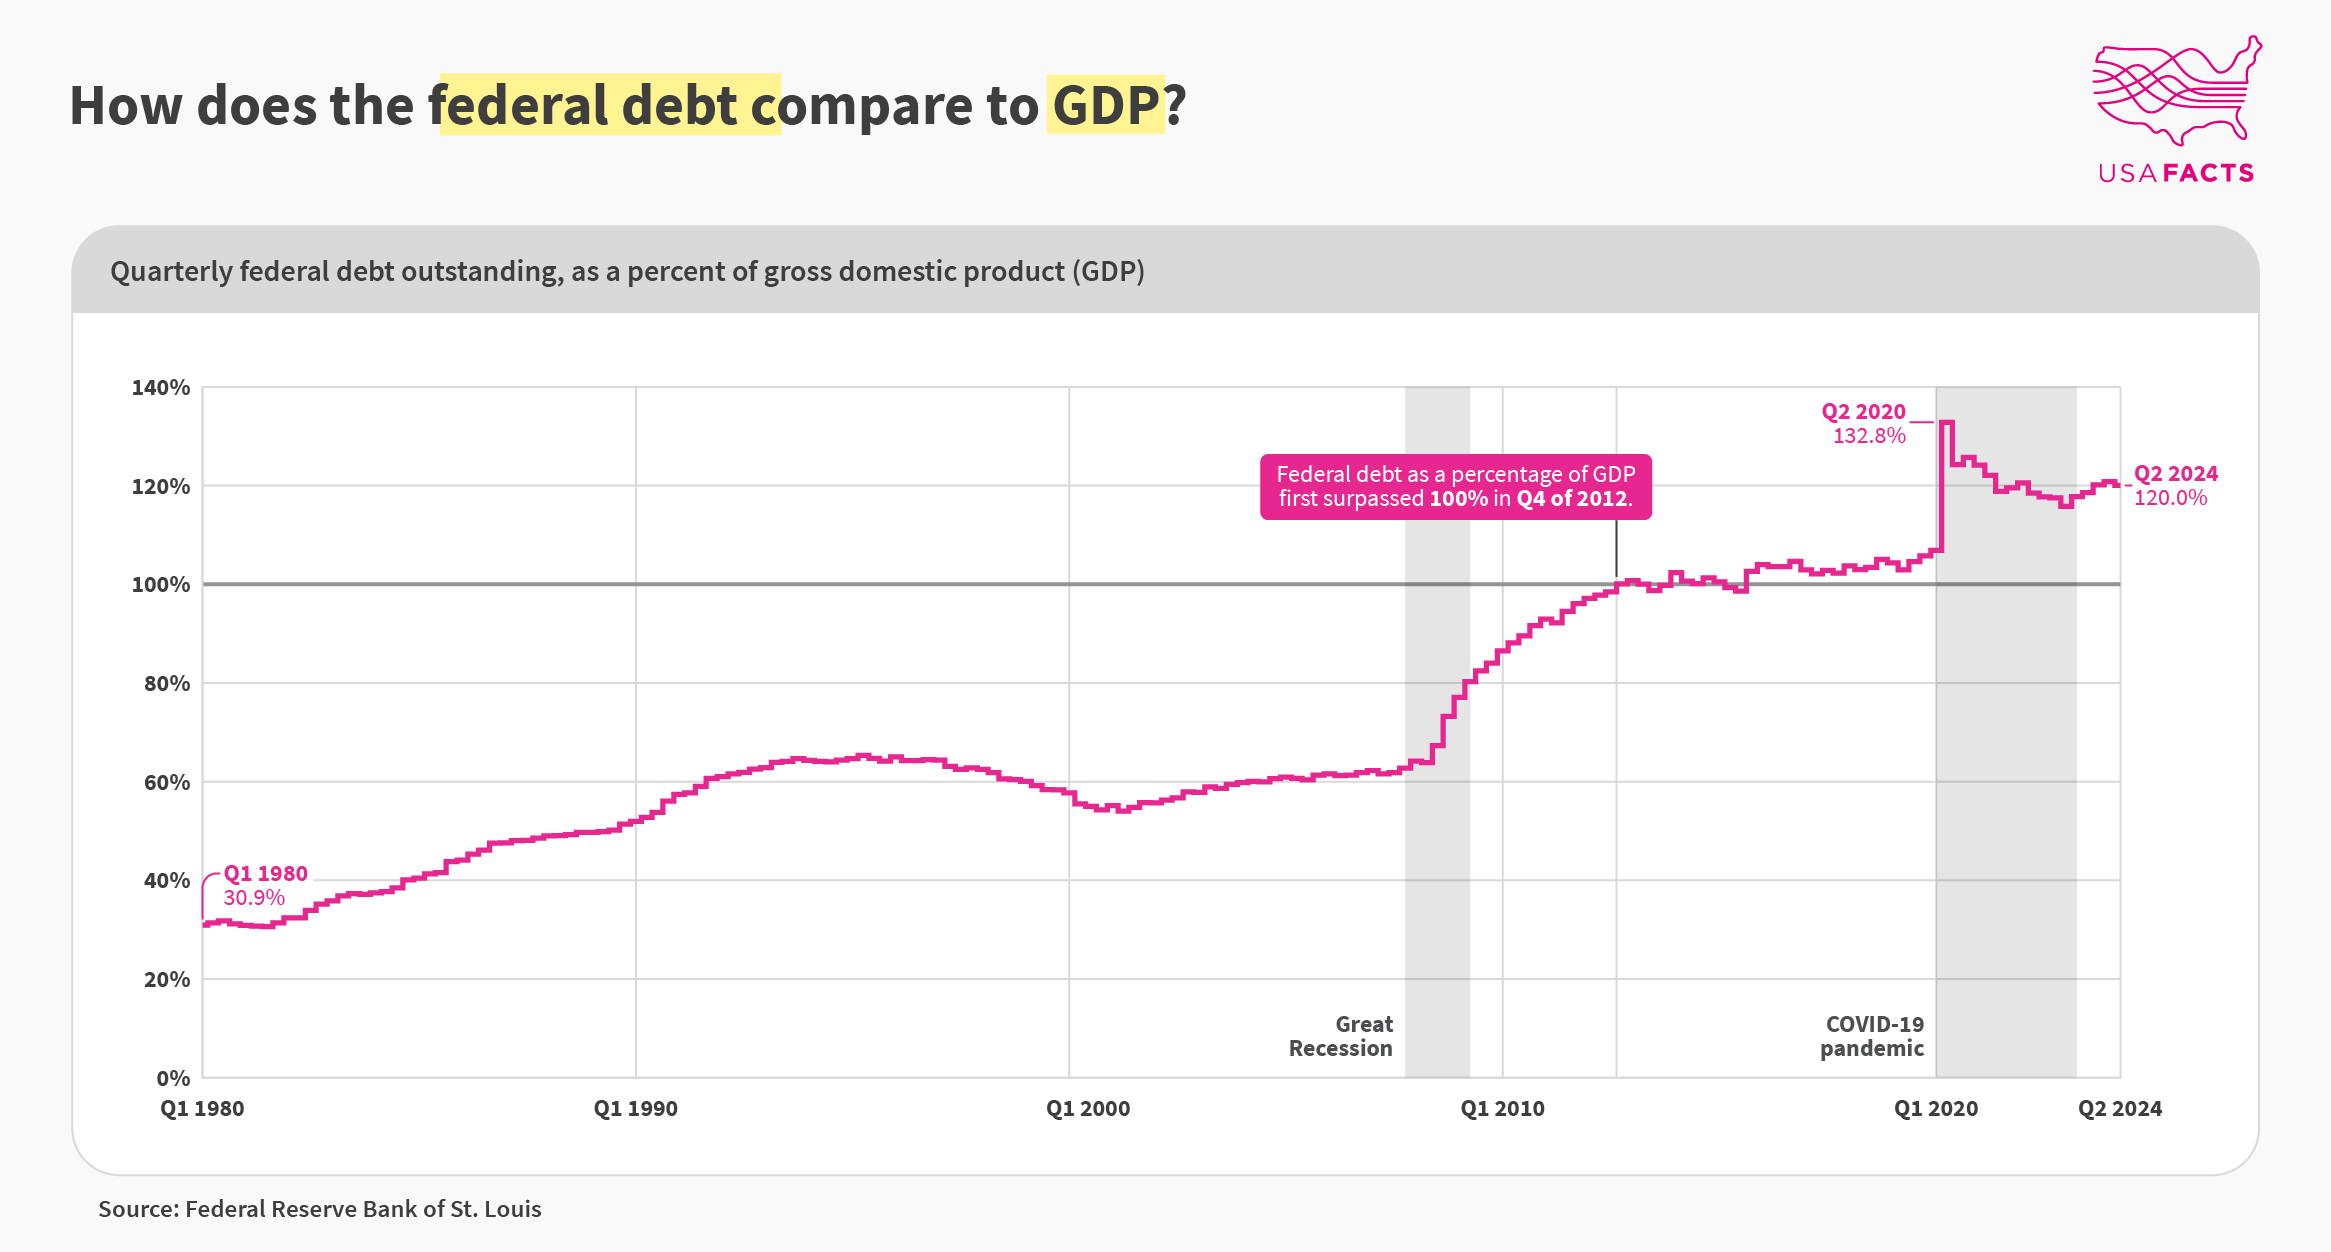
But let’s talk about this zig-zaggy chart:
Gross Domestic Product (GDP), broadly speaking, is a measure of the value of an economy. Analyzing the debt in context of GDP makes it easier to track the debt alongside changes in economy and inflation, allowing for comparisons of the debt over time. It can also indicate a country’s ability to repay its debt.
In the US, debt as a percentage of GDP first surpassed 100% in Q4 2012. It remained relatively stable until Q2 of 2020, when it decreased while spending increased. It reached 133% of GDP by the end of Q3. As of Q2 2024, the debt as a percentage of GDP was 120%.
This is a great visualization. It’s neat to see that largely, the debt to GDP ratio is unchanged since the 90’s, unless there is an event which causes it to go up, and then it levels off at that new ratio until there is another event that causes it to go up and then stabilize.
LongjumpingDemand300 on
Yup, the pandemic happened.
KinoftheFlames on
I may not be the only one that’s been living on credit since being laid off.

![The US National Debt vs. GDP [OC]](https://www.byteseu.com/wp-content/uploads/2025/01/ia7elqawvree1-1536x825.png "The US National Debt vs. GDP [OC]")
5 Comments
As of September 2024, the US national debt is $34.3 trillion. This is 4% higher than in September 2023 and up 27% from 2019, before the COVID-19 pandemic.
Per-person debt (dividing the total debt by the US population) has increased at an average rate of 5% per year since 2001. As of 2023 (the most recent population data) the federal debt was equivalent to $102,000 per person.
But let’s talk about this zig-zaggy chart:
Gross Domestic Product (GDP), broadly speaking, is a measure of the value of an economy. Analyzing the debt in context of GDP makes it easier to track the debt alongside changes in economy and inflation, allowing for comparisons of the debt over time. It can also indicate a country’s ability to repay its debt.
In the US, debt as a percentage of GDP first surpassed 100% in Q4 2012. It remained relatively stable until Q2 of 2020, when it decreased while spending increased. It reached 133% of GDP by the end of Q3. As of Q2 2024, the debt as a percentage of GDP was 120%.
More data and interactive charts [here](https://usafacts.org/answers/how-much-debt-does-the-us-have/country/united-states/).
Source: [St. Louis Fed](https://fred.stlouisfed.org/series/GFDEGDQ188S)
Tools: Illustrator
If you want to get real in the weeds with government spending, we have more data and interactive charts [here](https://usafacts.org/answers/how-much-debt-does-the-us-have/country/united-states/), and we published a new government spending Sankey chart (coming soon to Reddit, but it’s massive and fitting it into one image is posing some challenges) that you can check out [here](https://usafacts.org/government-spending/).
This is a great visualization. It’s neat to see that largely, the debt to GDP ratio is unchanged since the 90’s, unless there is an event which causes it to go up, and then it levels off at that new ratio until there is another event that causes it to go up and then stabilize.
Yup, the pandemic happened.
I may not be the only one that’s been living on credit since being laid off.