Wow, you can really see the surge away from nobody in the last 10 years. I wonder what caused that. I wonder what could have caused people to start suddenly feeling like they absolutely HAD to pick a candidate.
I’ve never seen a direct apples-to-apples comparison: of all the people who _could_ vote for president, how did they vote? I included “nobody” for people who didn’t vote at all (or in Nevada, explicitly voted for no one). Most data sources I’ve found online exclude people who didn’t vote or don’t show the full trend.
It’s surprisingly hard to find these data. Technically, no one is officially responsible for tallying the total popular vote, not even the FEC, from which I got most of the data. You have to go to each state (they _are_ responsible) to get their tallies and add them up. But that would mean dealing with a whole bunch of different formats and introduce a lot of possibility for human error.
So it’s not surprising that if you look at four different sources for these total popular vote tallies, you are highly likely to see four completely different sets of numbers. I cross-checked my numbers against other sources like Wikipedia and they were close enough that I’m convinced any errors are negligible.
Turnout estimates are also hard to find official sources for. It makes sense if you think about it: you need to gather census data for the time of the election and then estimate the number of people who could have voted, since obviously we don’t get any counts for the people who don’t show up. I don’t know how the FEC calculated their turnout estimate versus the University of Florida, so maybe the two aren’t properly comparable as I’ve shown here. But it felt odd to throw away the FEC turnout numbers when they were provided in the same data source, therefore I’ve only used Florida’s numbers when the FEC didn’t have it.
CodeWarrior30 on
Makes all the “a vote for a 3rd party is a wasted vote” comments look pretty silly. Bro, a vote for nobody is the real wasted vote and is apparently the most popular choice. Maybe the nobody voters think that if there are enough of them that we will just stop having elected officials?
5869523 on
This suggests a tightening of the popularity of the candidates. Pre-1990s it looks like for the most part one candidate was way more popular, which tracks with elections for Roosevelt, Eisenhower, Johnson, etc. Then in the 1990s the races start to tighten with two equally popular candidates, so e.g. Bush vs Gore. Cool to see it displayed like this.
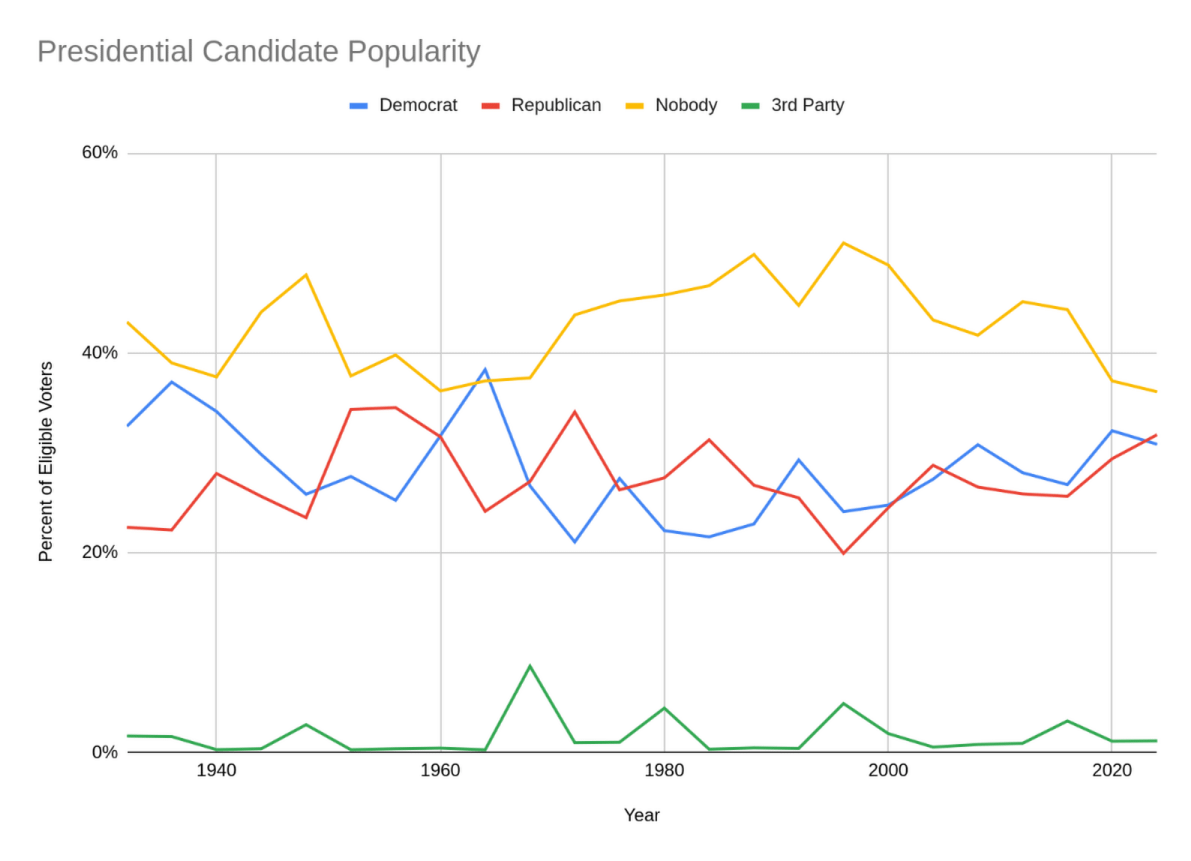

![[OC] US Presidential Candidate Popularity 1932-2024](https://www.byteseu.com/wp-content/uploads/2025/01/22nwsiwr6qee1-1024x740.png "[OC] US Presidential Candidate Popularity 1932-2024")
5 Comments
Wow, you can really see the surge away from nobody in the last 10 years. I wonder what caused that. I wonder what could have caused people to start suddenly feeling like they absolutely HAD to pick a candidate.
Couldn’t imagine.
## Sources
* All data for 1984-2024: https://www.fec.gov/introduction-campaign-finance/election-results-and-voting-information/
* Popular vote counts 1932-1980: https://uselectionatlas.org
* Turnout estimates 1932-1980 and 2024: https://election.lab.ufl.edu/2024-general-election-turnout/
## Tool
Google Sheets
https://docs.google.com/spreadsheets/d/1bjLkdl5rdC0j6LE2ImwPKU2ExMhlxIVqIItX25mJUtw/edit?usp=sharing
## Why did I make this?
I’ve never seen a direct apples-to-apples comparison: of all the people who _could_ vote for president, how did they vote? I included “nobody” for people who didn’t vote at all (or in Nevada, explicitly voted for no one). Most data sources I’ve found online exclude people who didn’t vote or don’t show the full trend.
It’s surprisingly hard to find these data. Technically, no one is officially responsible for tallying the total popular vote, not even the FEC, from which I got most of the data. You have to go to each state (they _are_ responsible) to get their tallies and add them up. But that would mean dealing with a whole bunch of different formats and introduce a lot of possibility for human error.
So it’s not surprising that if you look at four different sources for these total popular vote tallies, you are highly likely to see four completely different sets of numbers. I cross-checked my numbers against other sources like Wikipedia and they were close enough that I’m convinced any errors are negligible.
Turnout estimates are also hard to find official sources for. It makes sense if you think about it: you need to gather census data for the time of the election and then estimate the number of people who could have voted, since obviously we don’t get any counts for the people who don’t show up. I don’t know how the FEC calculated their turnout estimate versus the University of Florida, so maybe the two aren’t properly comparable as I’ve shown here. But it felt odd to throw away the FEC turnout numbers when they were provided in the same data source, therefore I’ve only used Florida’s numbers when the FEC didn’t have it.
Makes all the “a vote for a 3rd party is a wasted vote” comments look pretty silly. Bro, a vote for nobody is the real wasted vote and is apparently the most popular choice. Maybe the nobody voters think that if there are enough of them that we will just stop having elected officials?
This suggests a tightening of the popularity of the candidates. Pre-1990s it looks like for the most part one candidate was way more popular, which tracks with elections for Roosevelt, Eisenhower, Johnson, etc. Then in the 1990s the races start to tighten with two equally popular candidates, so e.g. Bush vs Gore. Cool to see it displayed like this.
How exactly is popularity measured?