I have a longer [blog post](https://blog.waldrn.com/p/the-decline-of-high-tech-manufacturing) about the topic, which includes a 1987 version of the map (below), as well as some charts showing the decline of high-tech manufacturing industries over the past 35 years.
I’m surprised the northeast isn’t higher. That spike in Mont Co PA is mostly Mercks’ largest manufacturing site. Nearby there are a bunch. Somerset Co NJ has a JnJ campus of similar footprint.
bsEEmsCE on
Very useful map for an EE/Computer Engineer. Thanks.
Material_Zombie on
I’m surprised Huntsville AL isn’t up there for aerospace instead of computer/electronics.
PunctualDealer on
Twin cities should have much more med device
SeaworthinessRude241 on
a map that’s actually NOT a population map. Very interesting. Chicagoland has almost nothing, which is surprising to me.
AnemoneOfMyEnemy on
Surprised to not see the Lockheed Martin plant northwest of Atlanta
UF0_T0FU on
St. Louis really punching above its weight among the formerly industrial Rust Belt cities.
VerbableNouns on
I feel targeted. I’ve worked in all three of those fields.
hyperiongate on
Deportation should open up a lot of high tech positions… right?
R_V_Z on
IMO car manufacturing should be included, as it is comparable to aerospace for the majority of what is being manufactured. Both use sheet metal forming and composites.
RunninOnMT on
Interesting that there are more people in Boeing than in Microsoft in the Seattle area. I wouldn’t have guessed that.
edwa2 on
Honeywell aerospace is based in pheonix? Why isn’t there a aerospace bump there, not sure I trust the data source that much
JanitorKarl on
Minneapolis area is well known for high tech medical device manufacturing.
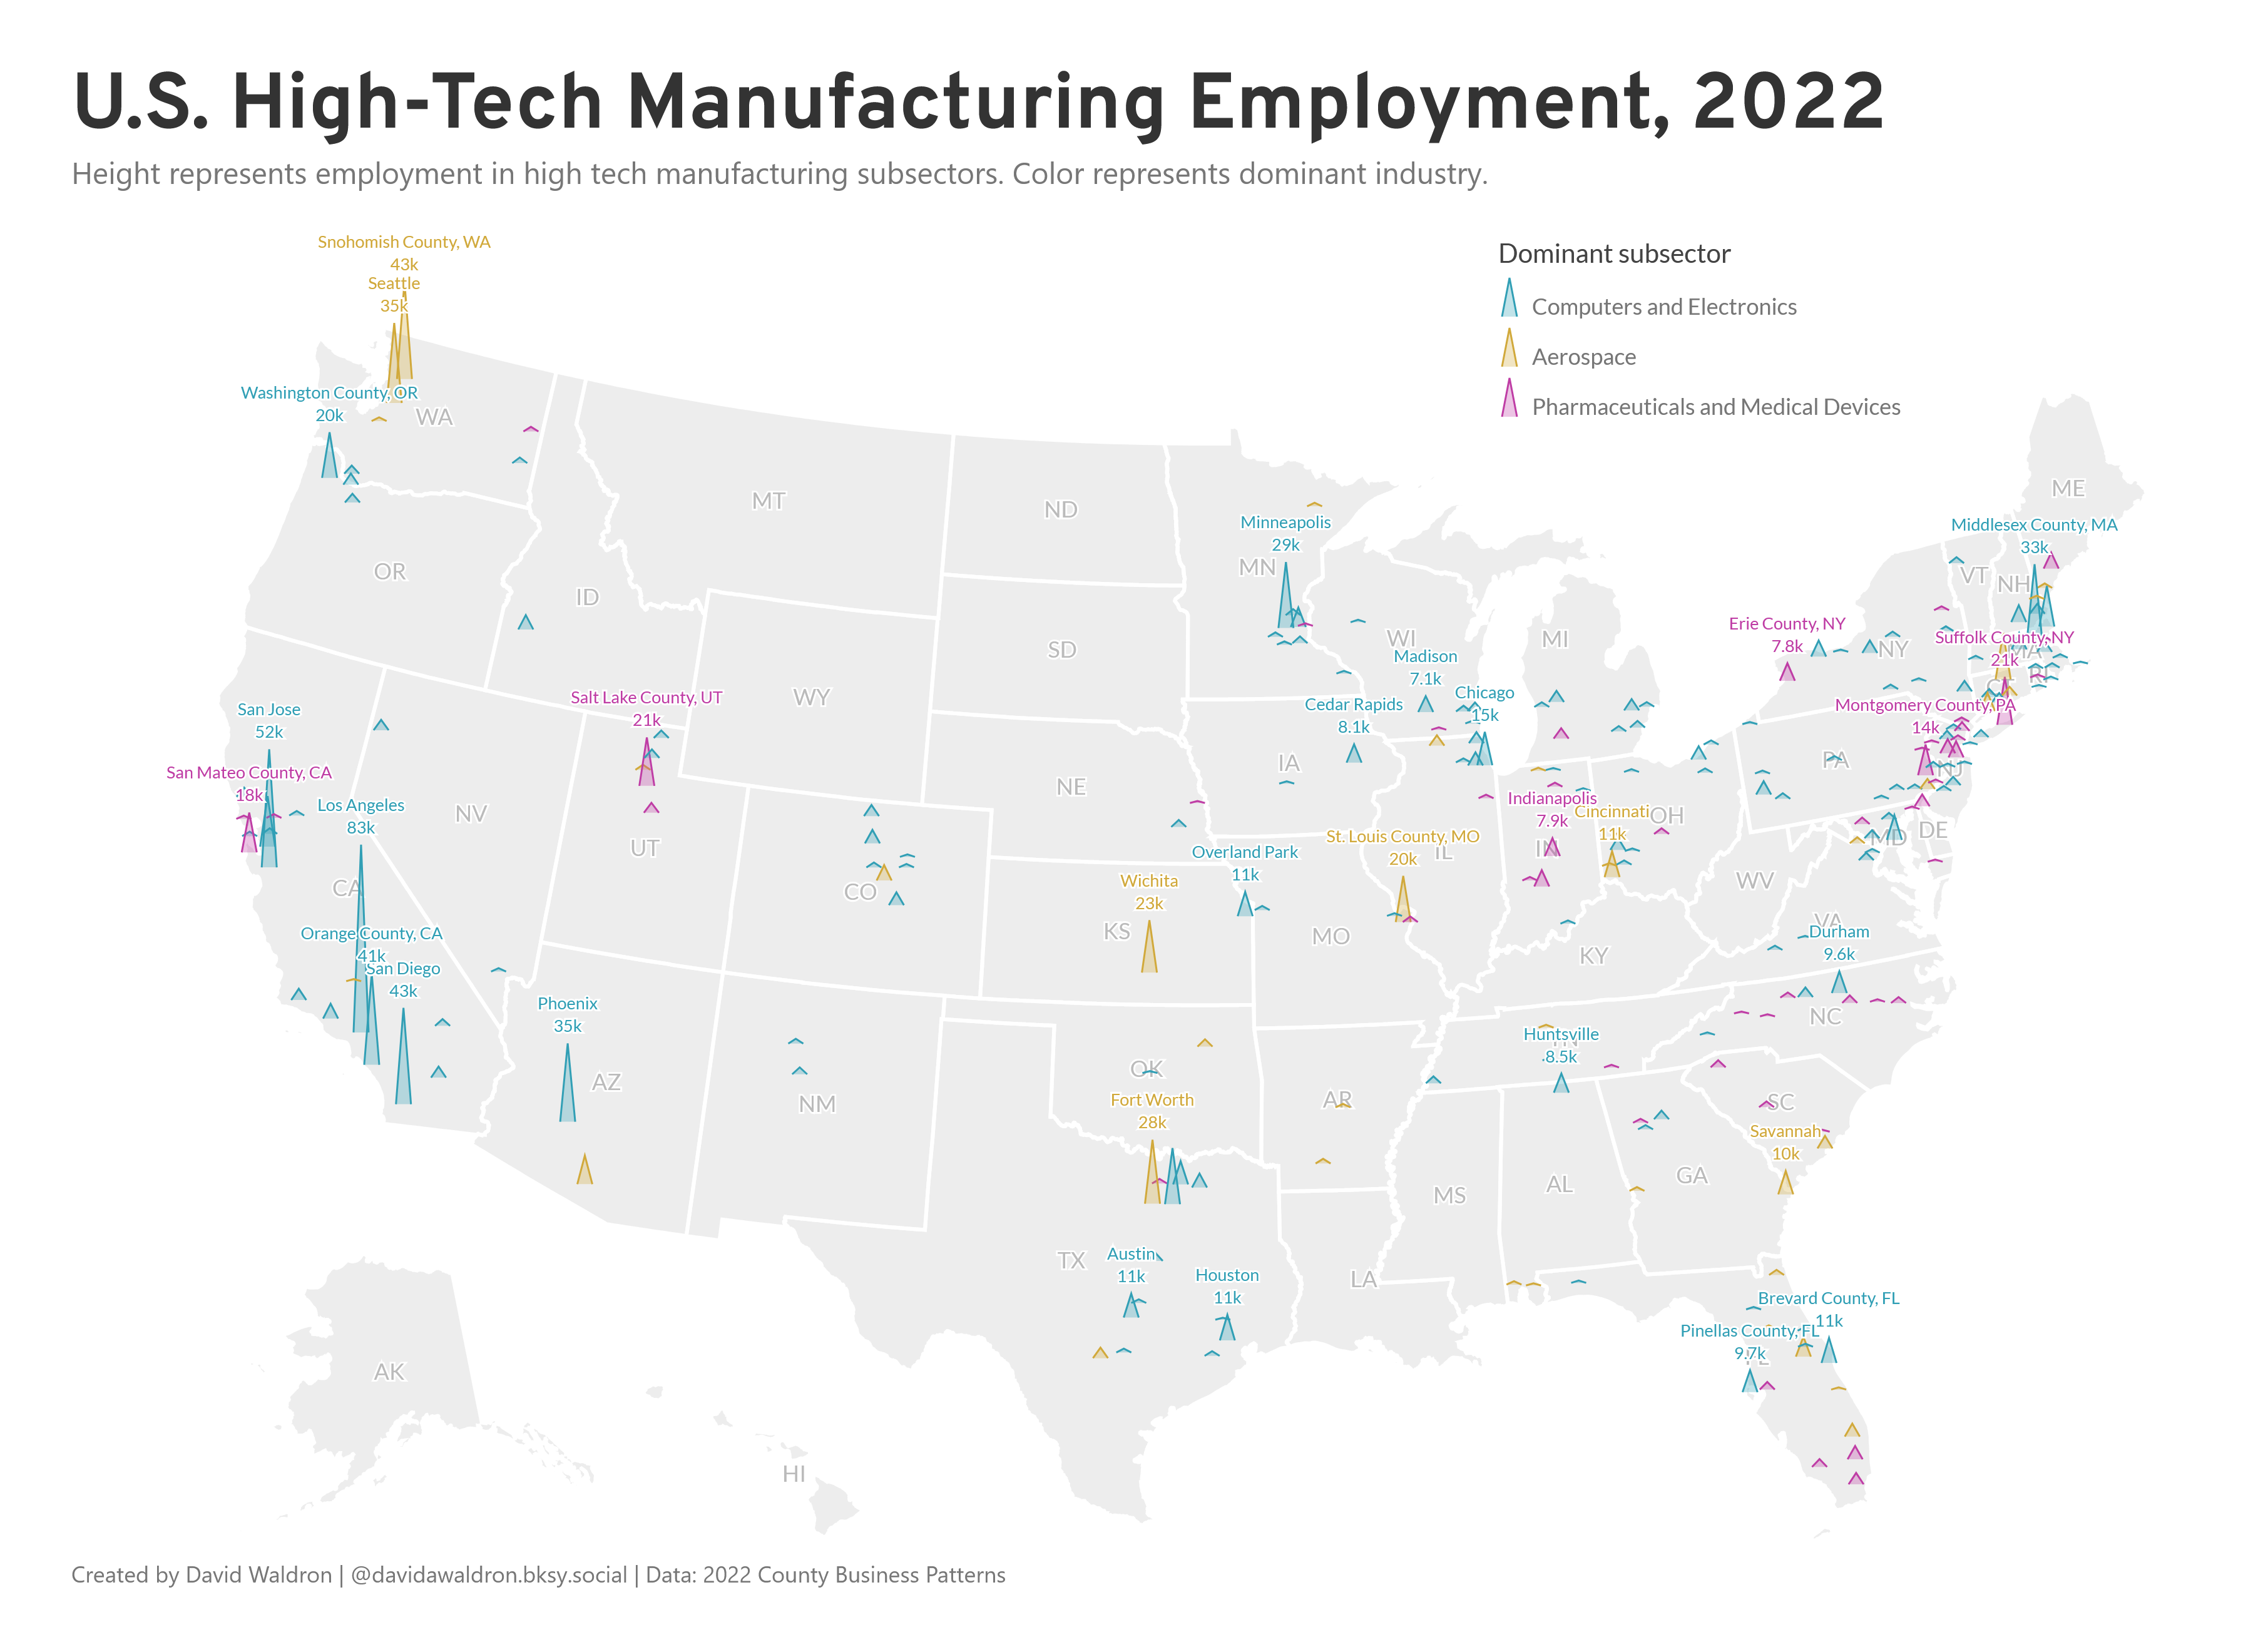

![Where is high-tech manufacturing in the United States? [OC]](https://www.byteseu.com/wp-content/uploads/2025/01/nh2f9trorxfe1-1536x1119.png "Where is high-tech manufacturing in the United States? [OC]")
14 Comments
The employment data comes from the Census Bureau’s [County Business Patterns](https://www.census.gov/programs-surveys/cbp/data.html). The industries identified are based on a [2012 Brookings report](https://www.nist.gov/system/files/documents/2017/05/09/Brookings_locating_american_manufacturing_report.pdf) on high-tech manufacturing. I used R to analyze the data and d3.js to make the map.
I have a longer [blog post](https://blog.waldrn.com/p/the-decline-of-high-tech-manufacturing) about the topic, which includes a 1987 version of the map (below), as well as some charts showing the decline of high-tech manufacturing industries over the past 35 years.
https://preview.redd.it/u4dk7yi7sxfe1.png?width=3624&format=png&auto=webp&s=ebf798c1aec50374d77c75fa1b5708ac5eb724a1
I’m surprised the northeast isn’t higher. That spike in Mont Co PA is mostly Mercks’ largest manufacturing site. Nearby there are a bunch. Somerset Co NJ has a JnJ campus of similar footprint.
Very useful map for an EE/Computer Engineer. Thanks.
I’m surprised Huntsville AL isn’t up there for aerospace instead of computer/electronics.
Twin cities should have much more med device
a map that’s actually NOT a population map. Very interesting. Chicagoland has almost nothing, which is surprising to me.
Surprised to not see the Lockheed Martin plant northwest of Atlanta
St. Louis really punching above its weight among the formerly industrial Rust Belt cities.
I feel targeted. I’ve worked in all three of those fields.
Deportation should open up a lot of high tech positions… right?
IMO car manufacturing should be included, as it is comparable to aerospace for the majority of what is being manufactured. Both use sheet metal forming and composites.
Interesting that there are more people in Boeing than in Microsoft in the Seattle area. I wouldn’t have guessed that.
Honeywell aerospace is based in pheonix? Why isn’t there a aerospace bump there, not sure I trust the data source that much
Minneapolis area is well known for high tech medical device manufacturing.