The taxation will continue until playoff performance improves.
trashking11 on
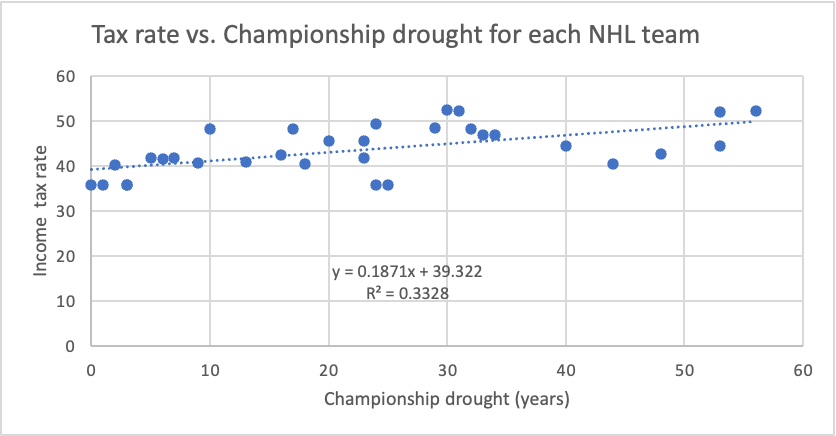
Honestly this is showing me that there is very little if any correlation between tax rate and cup drought. R2 value of .3328 shows very loose or no correlation
Aym42 on
This data would be much more interesting with a COL analysis, but even still, the data set is not particularly useful. I can immediately identify California as a fan, but that drought was 45 years originally. STL was 50 years until it wasn’t. Canada’s long standing drought strongly impacts this, but mot analysis, even in Kings winning era that considered COL and taxes vs salary cap, management of the Canadian teams was a much bigger influence. They’re simply stale, they have their markets held hostage, know they’ll sell enough merch regardless of performance, and are unmotivated to be leaner and more aggressive. Florida and Vegas recent performance is a whole other bag of worms for this data set that may mark a trend, but Vegas is also the result of a much different expansion draft. Anyway, while I believe COL and Taxes do play a role, this chart isn’t using the right data to show it.
Sick_Pangolin_369 on
Interesting general observation but hard to track with 30 observations, many of which haven’t had 50 years of actual history as an NHL team to actually refer to
tripping_on_phonics on
It would be interesting to compare this across multiple sports and see if the correlation still exists.
xen0m0rpheus on
Salary cap should obviously be AFTER tax. Anything else is just dumb.
xen0m0rpheus on
I think the better way to do this would be studying how far each team makes it in the playoffs each year vs tax rate, not something as arbitrary as cup droughts.
A lot of luck goes into a cup win, but consistent deep playoffs means more.
Plus now you’d have 30+ data point per season instead of just 32 data points total, which would yield much stronger results.

8 Comments
Created with MS excel
Sources:
https://cardinalpointathleteadvisors.com/nhl-tax-calculator/ (used average nhl salary of 3.5m)
https://en.wikipedia.org/wiki/List_of_NHL_franchise_post-season_droughts#Stanley_Cup_droughts
The taxation will continue until playoff performance improves.
Honestly this is showing me that there is very little if any correlation between tax rate and cup drought. R2 value of .3328 shows very loose or no correlation
This data would be much more interesting with a COL analysis, but even still, the data set is not particularly useful. I can immediately identify California as a fan, but that drought was 45 years originally. STL was 50 years until it wasn’t. Canada’s long standing drought strongly impacts this, but mot analysis, even in Kings winning era that considered COL and taxes vs salary cap, management of the Canadian teams was a much bigger influence. They’re simply stale, they have their markets held hostage, know they’ll sell enough merch regardless of performance, and are unmotivated to be leaner and more aggressive. Florida and Vegas recent performance is a whole other bag of worms for this data set that may mark a trend, but Vegas is also the result of a much different expansion draft. Anyway, while I believe COL and Taxes do play a role, this chart isn’t using the right data to show it.
Interesting general observation but hard to track with 30 observations, many of which haven’t had 50 years of actual history as an NHL team to actually refer to
It would be interesting to compare this across multiple sports and see if the correlation still exists.
Salary cap should obviously be AFTER tax. Anything else is just dumb.
I think the better way to do this would be studying how far each team makes it in the playoffs each year vs tax rate, not something as arbitrary as cup droughts.
A lot of luck goes into a cup win, but consistent deep playoffs means more.
Plus now you’d have 30+ data point per season instead of just 32 data points total, which would yield much stronger results.