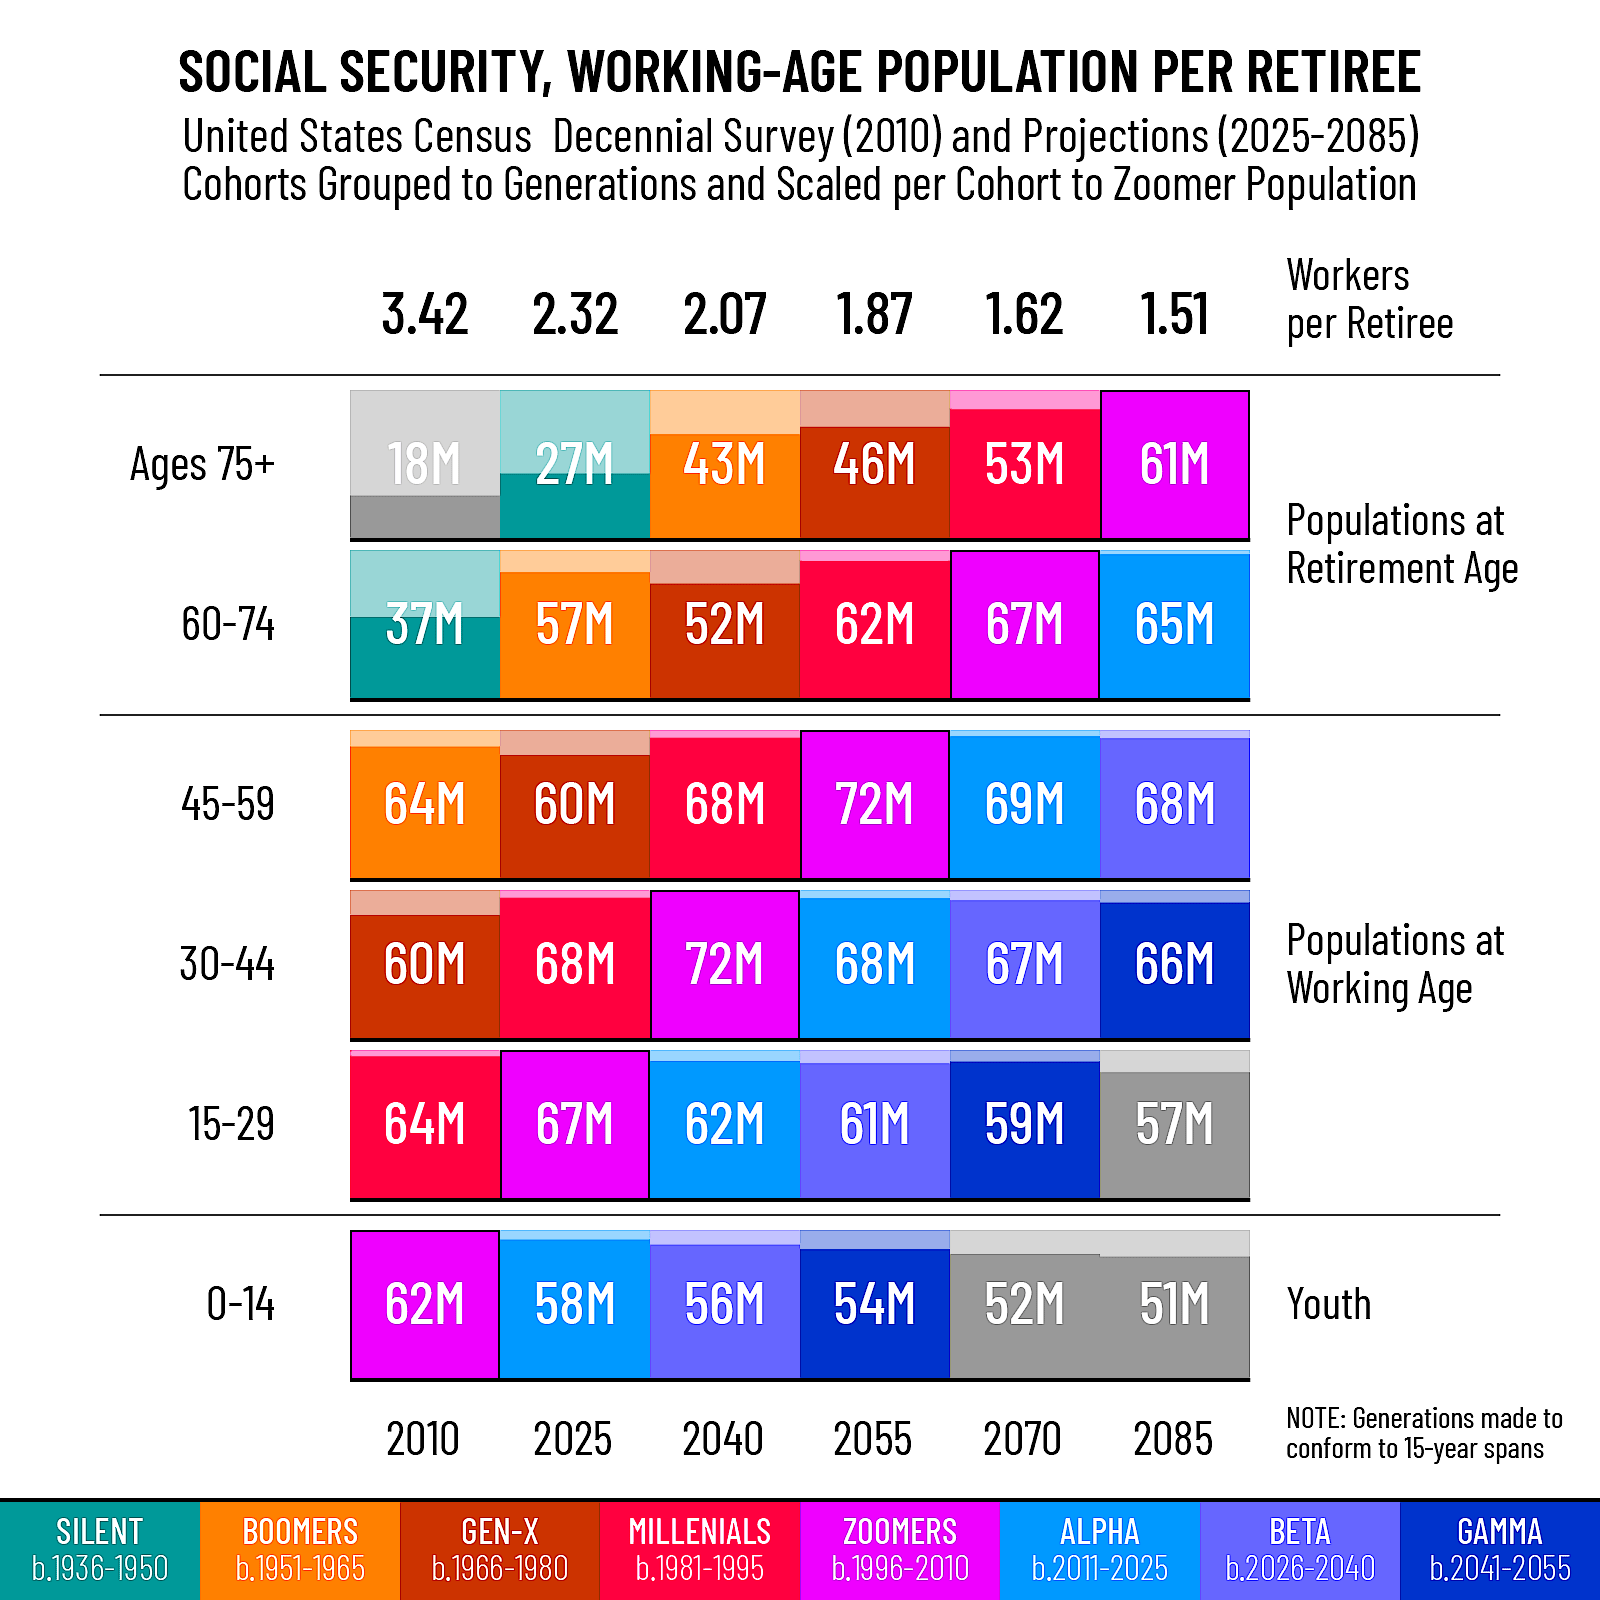
US Census Data (actual and projected) has been organized in 15-year cohorts to align with commonly-known Generations (e/g “Boomers”). The columnal years are also samplings at 15-year intervals to align with the last year of each named generation, thereby illustrating how each generation ages through career and retirement. The population per year and cohort are scaled relative to the key of the Zoomer population (which is the greatest in each instance).
Data cleaned and organized in Excel, aggregated in R, output to an SVG device, and then refined in Adobe Illustrator.
Sources
Census: Age and Sex Composition in the United States: 2010
I don’t like this vizualiation honestly. The cubes are differently sized between age groups, the diagonal progression of cohorts is strange because 75+ isnt one cohort and also there is very large immigration (assuming this is why cohorts grow over years) which is difficult to discern.
Aikuma- on
A bit confusing at first glance, but I’m guessing the main point is that in the next 60 years, the number of workers per retiree will be less than half of 2010’s numbers.
I’m not entirely certain why the generational names are included, other than perhaps to spell it out that the 2085 situation will be felt by the zoomers. But, I think it would be more relevant if the colors reflected size of each block, since that’s tangentially relevant to the workers per retiree metric.
namastay14509 on
It took me a moment to get the message, but it does tell a story.
yttropolis on
OP, I’ve seen you attempt to visualize this data across numerous attempts in the past few weeks and I haven’t really seen one that effectively displays all of the data you’re trying to display. I think this is due to just the sheer amount of slices that you’re trying to put all into a single visualization, which imho might be a bit too much all at once.
There’s also the issue of time. You’re trying to show progression (via the generations) but still maintain snapshots (via year/age). This means that at least one of these slices would need to be read diagonally, which can be very confusing and unintuitive.
I’m also not sure what the point of the scaling to Zoomer generation is about. It just complicates the visualization even more and doesn’t provide much value.
rabidrabitt on
It would be a shame if there was a mystical disease that quickly wiped out old people and left the young generally unharmed.
Imagine if such a disease was released onto the world (from a lab) it would ravage nursing homes and the world would lock down.
Anyone who didn’t want to put their life on pause was called grandma killer.
But thats the whole point isn’t it?
Achillies2heel on
All pyramid schemes fail eventually
Forking_Shirtballs on
What does “scaled per cohort to Zoomer population” mean? I don’t see any scaling. Unless you’re talking about re-chopping the generations to each be 15 years long. (Which I think is a good move, by the way).
My main complaint is the year range under each generation name is basically illegible. Otherwise, this is good work.
asielen on
I love that you keep trying different views into this data.
executivesphere on
Took me a minute to figure out, but this is nice. Novel presentation and legitimately informative.
agentkolter on
How are there more millennials in 2025 than there were in 2010? That doesn’t make sense.
KrzysziekZ on
I don’t understand why moving one block to the right and one up may increase the cohort. It could be dying off, but how is it growing?
trgnv on
I’m shocked by how dismissive so many people (especially young people) are of this on Reddit. People just wave this away as some non-issue pushed by billionaires (who would be the main benefactors of an aging society btw).
I really don’t get it.
LongjumpingArgument5 on
That chart seems a little suspect
Why does the one between the red and the orange that shows 60 million people between 45 and 59 dropped to 46 million people by time they are 75? That is a 24% drop
But the magenta shows 72 million people between 45 and 59 but only drops to 61 million at age 75. Which is less than a 16% drop.
Are they purposely saying less people are going to die off so that they can make the numbers show something different??
New_Acanthaceae709 on
This is really really hard to understand.
Jaded-Patience-4007 on
This so clear and such a nice way to present the cohorts over two dimensions. Effectively the population making the biggest contribution to social security is going to the biggest draw…hence the urgency to reduce / eliminate incremental payouts. Nice!

![[OC] Social Security, Working-Age Population per Retiree, by Generations, 2010-2085](https://www.byteseu.com/wp-content/uploads/2025/02/n81y522zzbke1-1536x1536.png "[OC] Social Security, Working-Age Population per Retiree, by Generations, 2010-2085")
16 Comments
US Census Data (actual and projected) has been organized in 15-year cohorts to align with commonly-known Generations (e/g “Boomers”). The columnal years are also samplings at 15-year intervals to align with the last year of each named generation, thereby illustrating how each generation ages through career and retirement. The population per year and cohort are scaled relative to the key of the Zoomer population (which is the greatest in each instance).
Data cleaned and organized in Excel, aggregated in R, output to an SVG device, and then refined in Adobe Illustrator.
Sources
Census: Age and Sex Composition in the United States: 2010
[https://www.census.gov/data/tables/2010/demo/age-and-sex/2010-age-sex-composition.html](https://www.census.gov/data/tables/2010/demo/age-and-sex/2010-age-sex-composition.html)
Census: National Population Projections Tables: Main Series: 2023-2100
[https://www.census.gov/data/tables/2023/demo/popproj/2023-summary-tables.html](https://www.census.gov/data/tables/2023/demo/popproj/2023-summary-tables.html)
Census: Raw Archive: 1970-2024
[https://www2.census.gov/programs-surveys/popest/](https://www2.census.gov/programs-surveys/popest/)
Reference (for further study of similar demographics):
[https://usafacts.org/data/topics/people-society/population-and-demographics/our-changing-population/](https://usafacts.org/data/topics/people-society/population-and-demographics/our-changing-population/)
I don’t like this vizualiation honestly. The cubes are differently sized between age groups, the diagonal progression of cohorts is strange because 75+ isnt one cohort and also there is very large immigration (assuming this is why cohorts grow over years) which is difficult to discern.
A bit confusing at first glance, but I’m guessing the main point is that in the next 60 years, the number of workers per retiree will be less than half of 2010’s numbers.
I’m not entirely certain why the generational names are included, other than perhaps to spell it out that the 2085 situation will be felt by the zoomers. But, I think it would be more relevant if the colors reflected size of each block, since that’s tangentially relevant to the workers per retiree metric.
It took me a moment to get the message, but it does tell a story.
OP, I’ve seen you attempt to visualize this data across numerous attempts in the past few weeks and I haven’t really seen one that effectively displays all of the data you’re trying to display. I think this is due to just the sheer amount of slices that you’re trying to put all into a single visualization, which imho might be a bit too much all at once.
There’s also the issue of time. You’re trying to show progression (via the generations) but still maintain snapshots (via year/age). This means that at least one of these slices would need to be read diagonally, which can be very confusing and unintuitive.
I’m also not sure what the point of the scaling to Zoomer generation is about. It just complicates the visualization even more and doesn’t provide much value.
It would be a shame if there was a mystical disease that quickly wiped out old people and left the young generally unharmed.
Imagine if such a disease was released onto the world (from a lab) it would ravage nursing homes and the world would lock down.
Anyone who didn’t want to put their life on pause was called grandma killer.
But thats the whole point isn’t it?
All pyramid schemes fail eventually
What does “scaled per cohort to Zoomer population” mean? I don’t see any scaling. Unless you’re talking about re-chopping the generations to each be 15 years long. (Which I think is a good move, by the way).
My main complaint is the year range under each generation name is basically illegible. Otherwise, this is good work.
I love that you keep trying different views into this data.
Took me a minute to figure out, but this is nice. Novel presentation and legitimately informative.
How are there more millennials in 2025 than there were in 2010? That doesn’t make sense.
I don’t understand why moving one block to the right and one up may increase the cohort. It could be dying off, but how is it growing?
I’m shocked by how dismissive so many people (especially young people) are of this on Reddit. People just wave this away as some non-issue pushed by billionaires (who would be the main benefactors of an aging society btw).
I really don’t get it.
That chart seems a little suspect
Why does the one between the red and the orange that shows 60 million people between 45 and 59 dropped to 46 million people by time they are 75? That is a 24% drop
But the magenta shows 72 million people between 45 and 59 but only drops to 61 million at age 75. Which is less than a 16% drop.
Are they purposely saying less people are going to die off so that they can make the numbers show something different??
This is really really hard to understand.
This so clear and such a nice way to present the cohorts over two dimensions. Effectively the population making the biggest contribution to social security is going to the biggest draw…hence the urgency to reduce / eliminate incremental payouts. Nice!