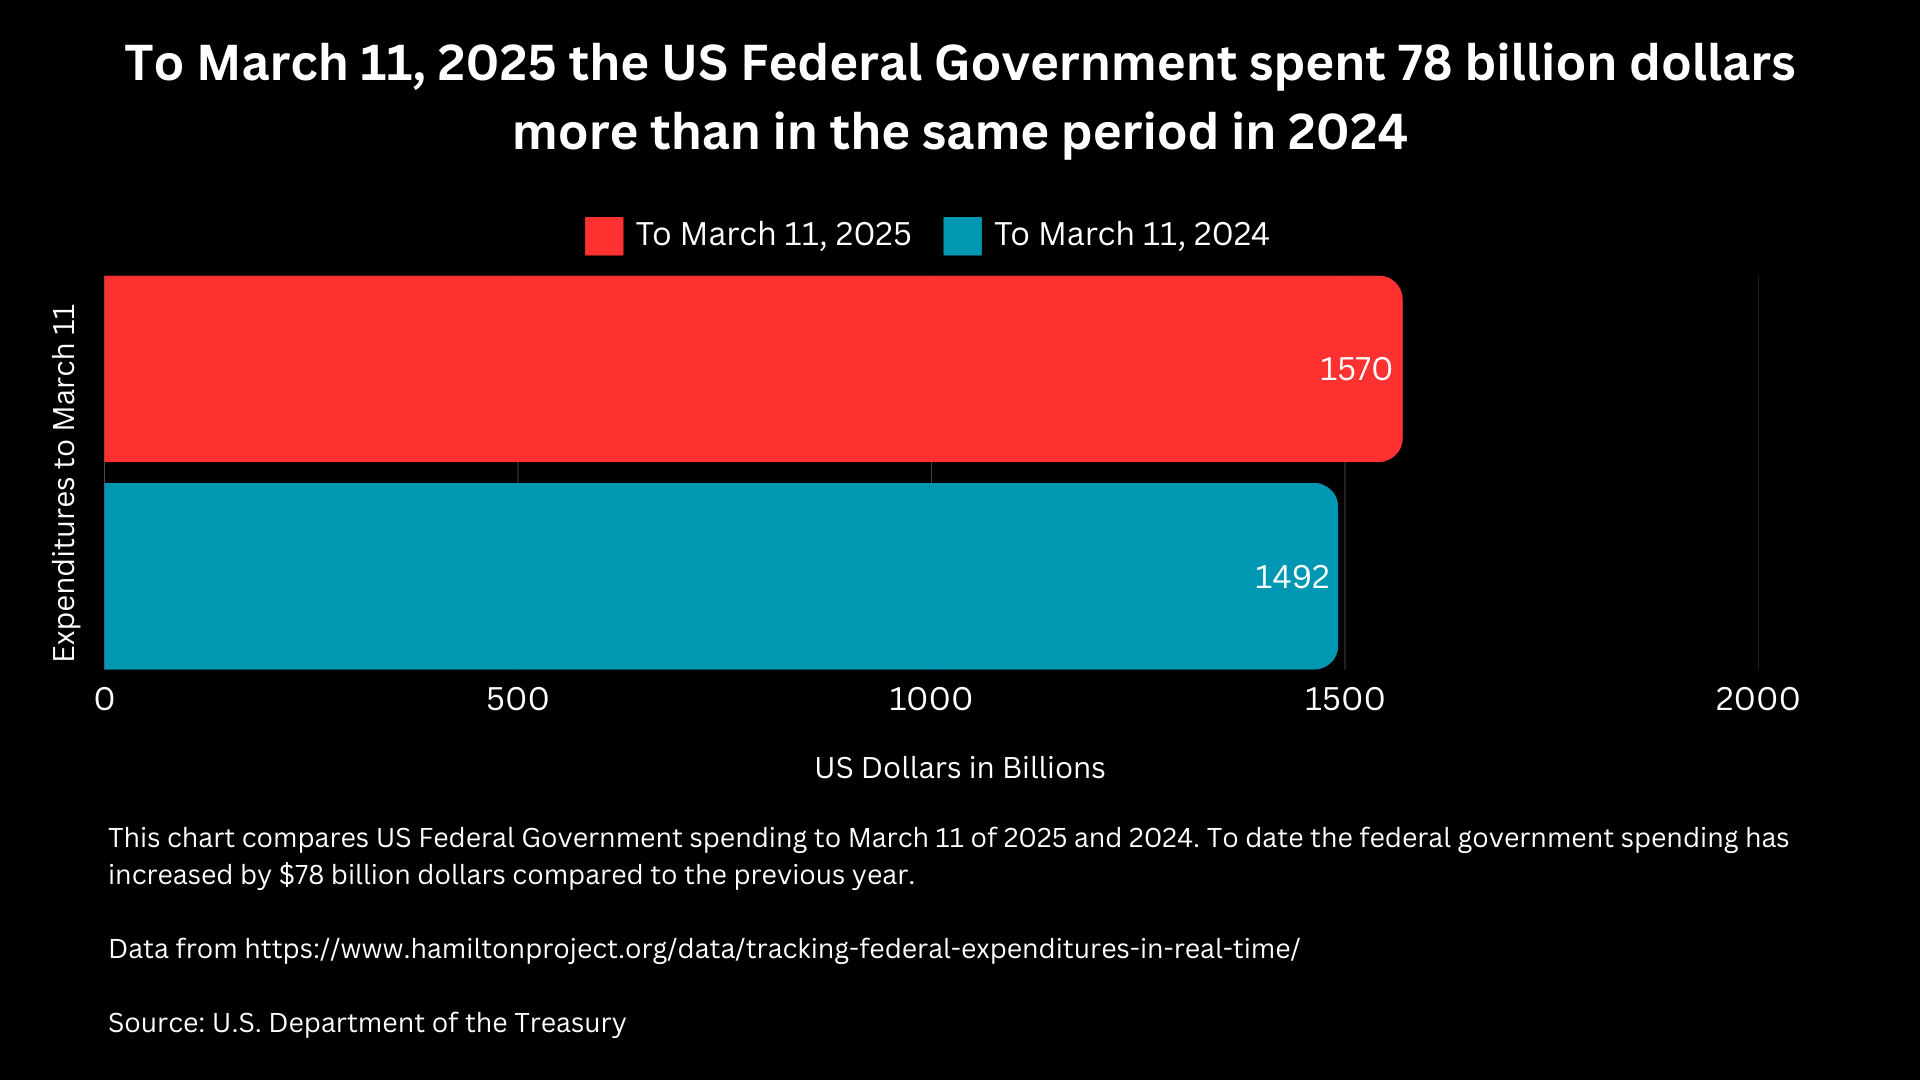
[OC] To March 11, 2025 the US Federal Government spent 78 billion dollars more than in the same period in 2024
Posted by 1234username4567

![[OC] To March 11, 2025 the US Federal Government spent 78 billion dollars more than in the same period in 2024](https://www.byteseu.com/wp-content/uploads/2025/03/rlk2ccqrcioe1-1536x864.png "[OC] To March 11, 2025 the US Federal Government spent 78 billion dollars more than in the same period in 2024")
[OC] To March 11, 2025 the US Federal Government spent 78 billion dollars more than in the same period in 2024
Posted by 1234username4567
9 Comments
This data is harder to find than normal so I will give you a step-by-step.
1. Go to https://www.hamiltonproject.org/data/tracking-federal-expenditures-in-real-time/
1. Click on “Compare Outlays by Year” tab
1. When you mouse over the chart, you will see “compare data on hover”, click on that
1. Mouse over the graph on whichever date you want. In this case I looked at March, 11 2024 and 2025.
Made with Canva
Edit: Time periods compared are from January 1st 2025 and January 1st 2024
You think those Cybertrucks are free?
I wonder if that includes the debt repayments on those trillions of dollars the government owes. You know, one of the main reasons why orange turd is tanking the economy, getting the interest rate down…
While I appreciate the sentiment, 70-80% of federal costs are for prior contracts and grants or other non discretionary costs. Was this inflation adjusted? Depicting this is a common disinformation whenever there is any new administration.
It’s be more accurate to find a source for discretionary spending, but I suspect that is harder to find
Only sith deal it absolutes, gimme per capita in real dollars
From when? January 1? Since Trump inauguration on Jan 20? In the last year (I know it’s not this one because it’s not high enough)?
This really need to say the start of the period
So why are people complaining about cuts?
Transfer of power is always going to be expensive. Would it be more legitimate to cf. 2025 with Q1 2021..?
Federal government fiscal year starts in October. This doesn’t really mean much