In 2015, the US Supreme Court ruled on Obergefell v. Hodges, thereby legalizing same-sex marriage nationwide. Households headed by same-sex couples have increased 131.3%, from 334,829 in 2014 before the ruling to 774,553 in 2023.
Even before Obergefell v. Hodges, the number of households with same-sex couples was rising as some states legalized same-sex marriage in the mid-2000s. By the time same-sex marriage was legalized federally, it had already been legal in 38 states and Washington, DC.
But let’s get back to this map, which is focused on the time since Obergefell v. Hodges.
Since 2014, Montana had the largest increase in married same-sex households, 466.5%. Montana started with one of the lowest counts, however — 540 married households in 2014 — which grew to 3,059 by 2023. Nevada followed at 361.5%, and Georgia was third at 258.9%.
The number of same-sex marriage households doubled in all but 10 states and grew in every state except Iowa (where same-sex marriage was legalized in 2009). The number of Iowa households headed by someone in a same-sex marriage fell from 4,653 households in 2014 to 4,123 in 2023 — down 11%.
In 2009, Iowa was the third state to legalize same sex marriage (after MA and CT). The next “red as of 2024” state to legalize it was Pennsylvania, #18, in May 2014. So basically, Iowa was the only now-red state to have legal gay marriage well before the 2014 starting point of this data. Given political shifts in Iowa since 2014, I could see LGBT households leaving, contributing to the only percent decline in the graphic.
It could be helpful to add a symbol or texture to states that had legal gay marriage *before* 2014. Sixteen states legalized it before 2014, while 19 more did so in 2014.
tristanjones on
Is Montana some kind of small base population issue? Like did it go from 3 gay marriages to 17 or something?
Betrix5068 on
Fuck’s happening in ~~Indiana~~ Iowa?
jpbay on
I know that a ton of people with money from California (and likely other liberal places like Washington) moved to Montana during/since the pandemic. My guess is that the huge jump in married gay couples there is due to them moving in from other states.
Unhappy_Poetry_8756 on
The Iowa situation is pretty simple to understand and the ridiculous theories here are hilarious to read.
Iowa had legal gay marriage in 2014 when all its neighbors did not. So lots of people from surrounding states came into Iowa to get married in 2014. Now that gay marriage is legal nationally, they don’t see that big influx from their neighbors, so it looks like a decline.
Fidel_Costco on
Can’t blame people for getting the fuck out of Iowa.
Sum-Duud on
give it a chance for the administration to push their “traditional Christian values” and we will see some change. I was actually surprised that the Kim Davis hasn’t received presidential intervention to support her.
CuppaTeaThreesome on
Percentage increases are unclear without real numbers. A 466% increase sounds large, but it depends on the starting value.
Government data is often a bother
CuppaTeaThreesome on
Percentage increases are unclear without real numbers. A 466% increase sounds large, but it depends on the starting value.
Government data is often a bother
The_Grizzly_Bear on
OK, what is with all the gay loving in Montana?
wkrick on
The most shocking thing about this data is Idaho.
I’m a straight person and I would never move to Idaho.
NurturingMaster on
Biggest changes towards gay marriage seem to be in Red states.

![[OC] How is gay marriage changing in the US?](https://www.byteseu.com/wp-content/uploads/2025/03/k0eauqhurooe1-1536x953.png "[OC] How is gay marriage changing in the US?")
14 Comments
Source: [US Census Bureau](https://data.census.gov/table/ACSDT1Y2023.B11009?q=B11009:%20COUPLED%20HOUSEHOLDS%20BY%20TYPE&g=010XX00US$0400000&moe=false)
Tools: Datawrapper, Illustrator
More data [here](https://usafacts.org/articles/what-is-the-state-of-gay-marriage-in-the-us/)
A bit of background on this chart:
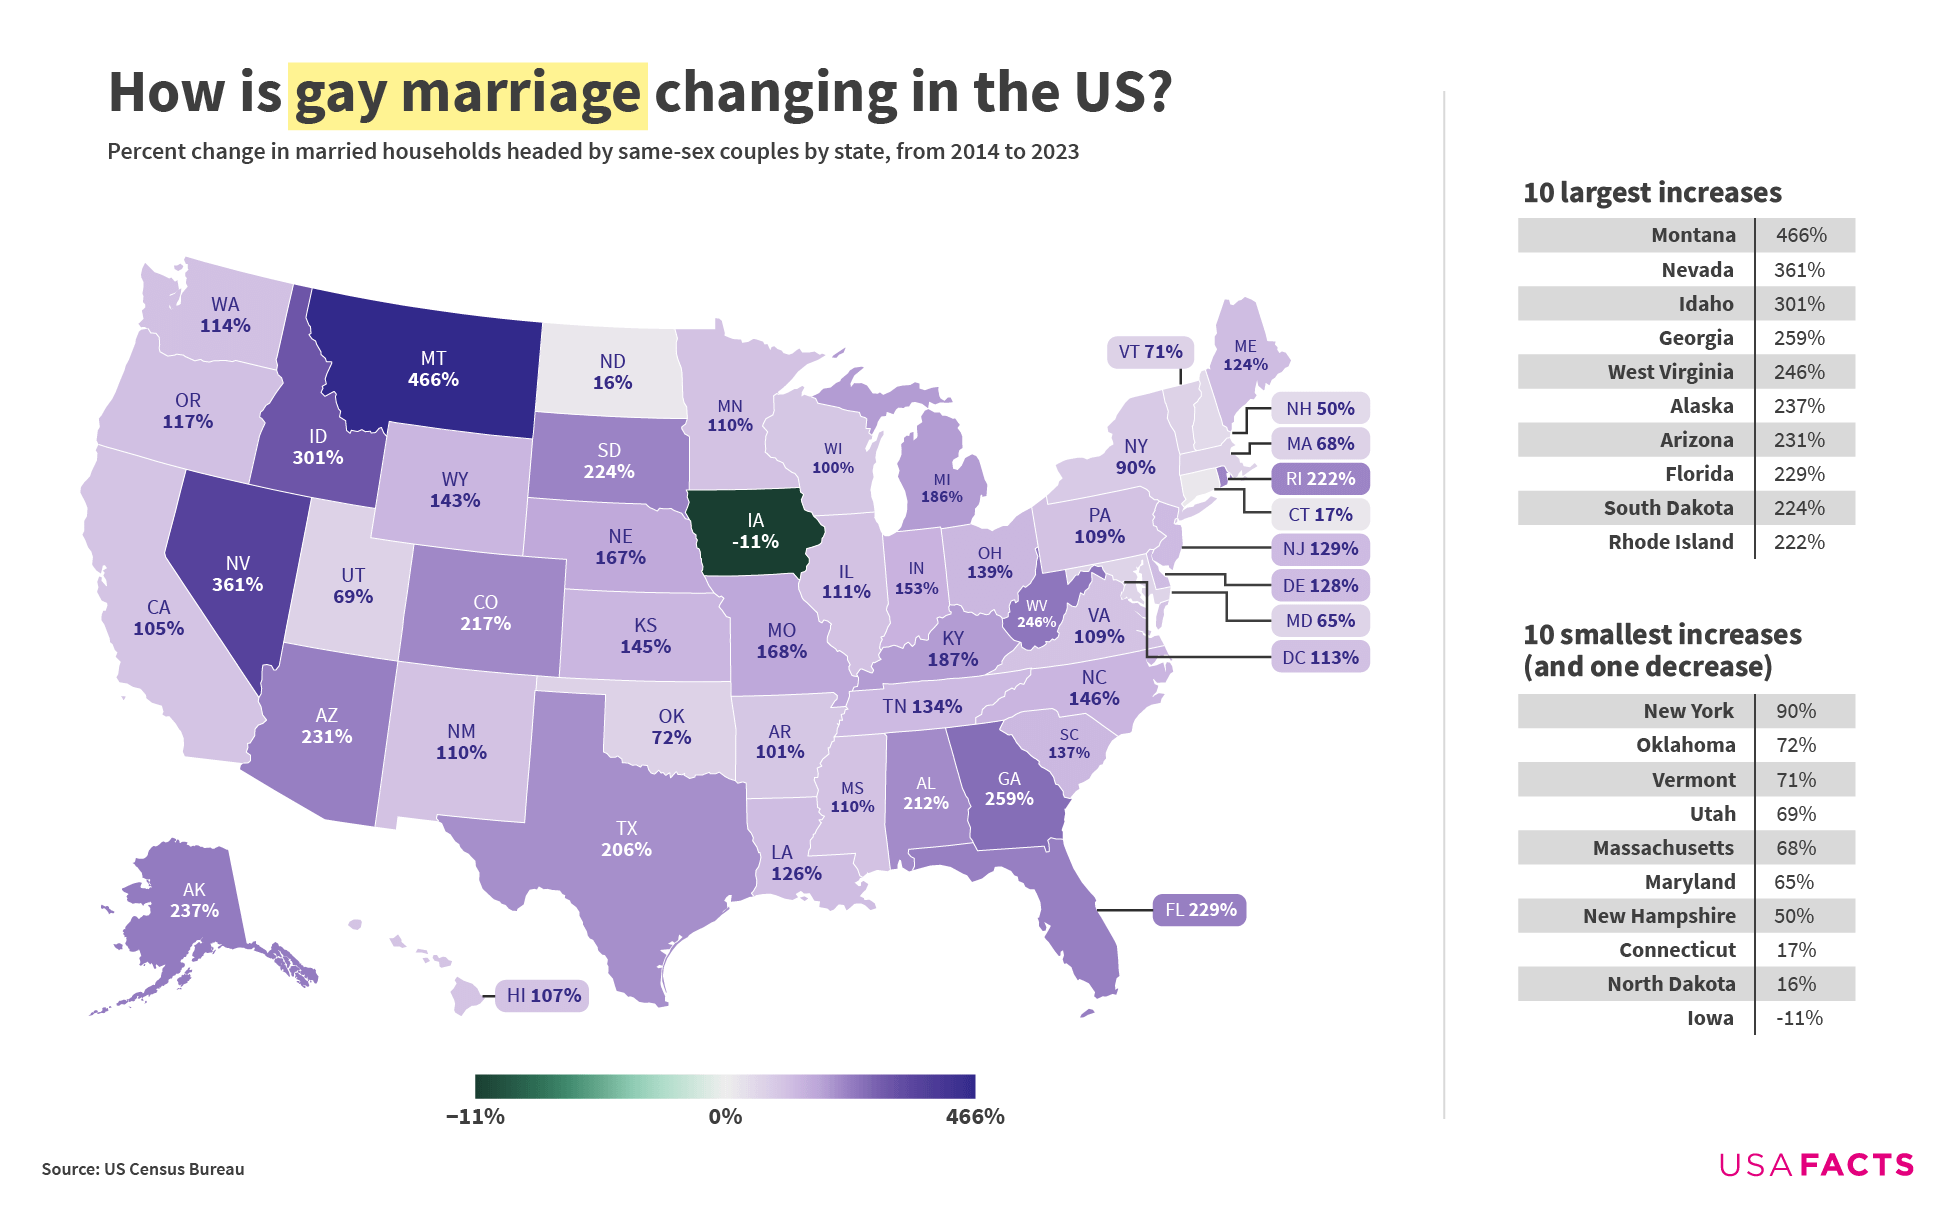
In 2015, the US Supreme Court ruled on Obergefell v. Hodges, thereby legalizing same-sex marriage nationwide. Households headed by same-sex couples have increased 131.3%, from 334,829 in 2014 before the ruling to 774,553 in 2023.
Even before Obergefell v. Hodges, the number of households with same-sex couples was rising as some states legalized same-sex marriage in the mid-2000s. By the time same-sex marriage was legalized federally, it had already been legal in 38 states and Washington, DC.
But let’s get back to this map, which is focused on the time since Obergefell v. Hodges.
Since 2014, Montana had the largest increase in married same-sex households, 466.5%. Montana started with one of the lowest counts, however — 540 married households in 2014 — which grew to 3,059 by 2023. Nevada followed at 361.5%, and Georgia was third at 258.9%.
The number of same-sex marriage households doubled in all but 10 states and grew in every state except Iowa (where same-sex marriage was legalized in 2009). The number of Iowa households headed by someone in a same-sex marriage fell from 4,653 households in 2014 to 4,123 in 2023 — down 11%.
More data [here](https://usafacts.org/articles/what-is-the-state-of-gay-marriage-in-the-us/).
In 2009, Iowa was the third state to legalize same sex marriage (after MA and CT). The next “red as of 2024” state to legalize it was Pennsylvania, #18, in May 2014. So basically, Iowa was the only now-red state to have legal gay marriage well before the 2014 starting point of this data. Given political shifts in Iowa since 2014, I could see LGBT households leaving, contributing to the only percent decline in the graphic.
It could be helpful to add a symbol or texture to states that had legal gay marriage *before* 2014. Sixteen states legalized it before 2014, while 19 more did so in 2014.
Is Montana some kind of small base population issue? Like did it go from 3 gay marriages to 17 or something?
Fuck’s happening in ~~Indiana~~ Iowa?
I know that a ton of people with money from California (and likely other liberal places like Washington) moved to Montana during/since the pandemic. My guess is that the huge jump in married gay couples there is due to them moving in from other states.
The Iowa situation is pretty simple to understand and the ridiculous theories here are hilarious to read.
Iowa had legal gay marriage in 2014 when all its neighbors did not. So lots of people from surrounding states came into Iowa to get married in 2014. Now that gay marriage is legal nationally, they don’t see that big influx from their neighbors, so it looks like a decline.
Can’t blame people for getting the fuck out of Iowa.
give it a chance for the administration to push their “traditional Christian values” and we will see some change. I was actually surprised that the Kim Davis hasn’t received presidential intervention to support her.
Percentage increases are unclear without real numbers. A 466% increase sounds large, but it depends on the starting value.
Government data is often a bother
Percentage increases are unclear without real numbers. A 466% increase sounds large, but it depends on the starting value.
Government data is often a bother
OK, what is with all the gay loving in Montana?
The most shocking thing about this data is Idaho.
I’m a straight person and I would never move to Idaho.
Biggest changes towards gay marriage seem to be in Red states.