Share Facebook Twitter LinkedIn Pinterest Bluesky Threads [OC] US population history, split by age group Posted by GraphCog
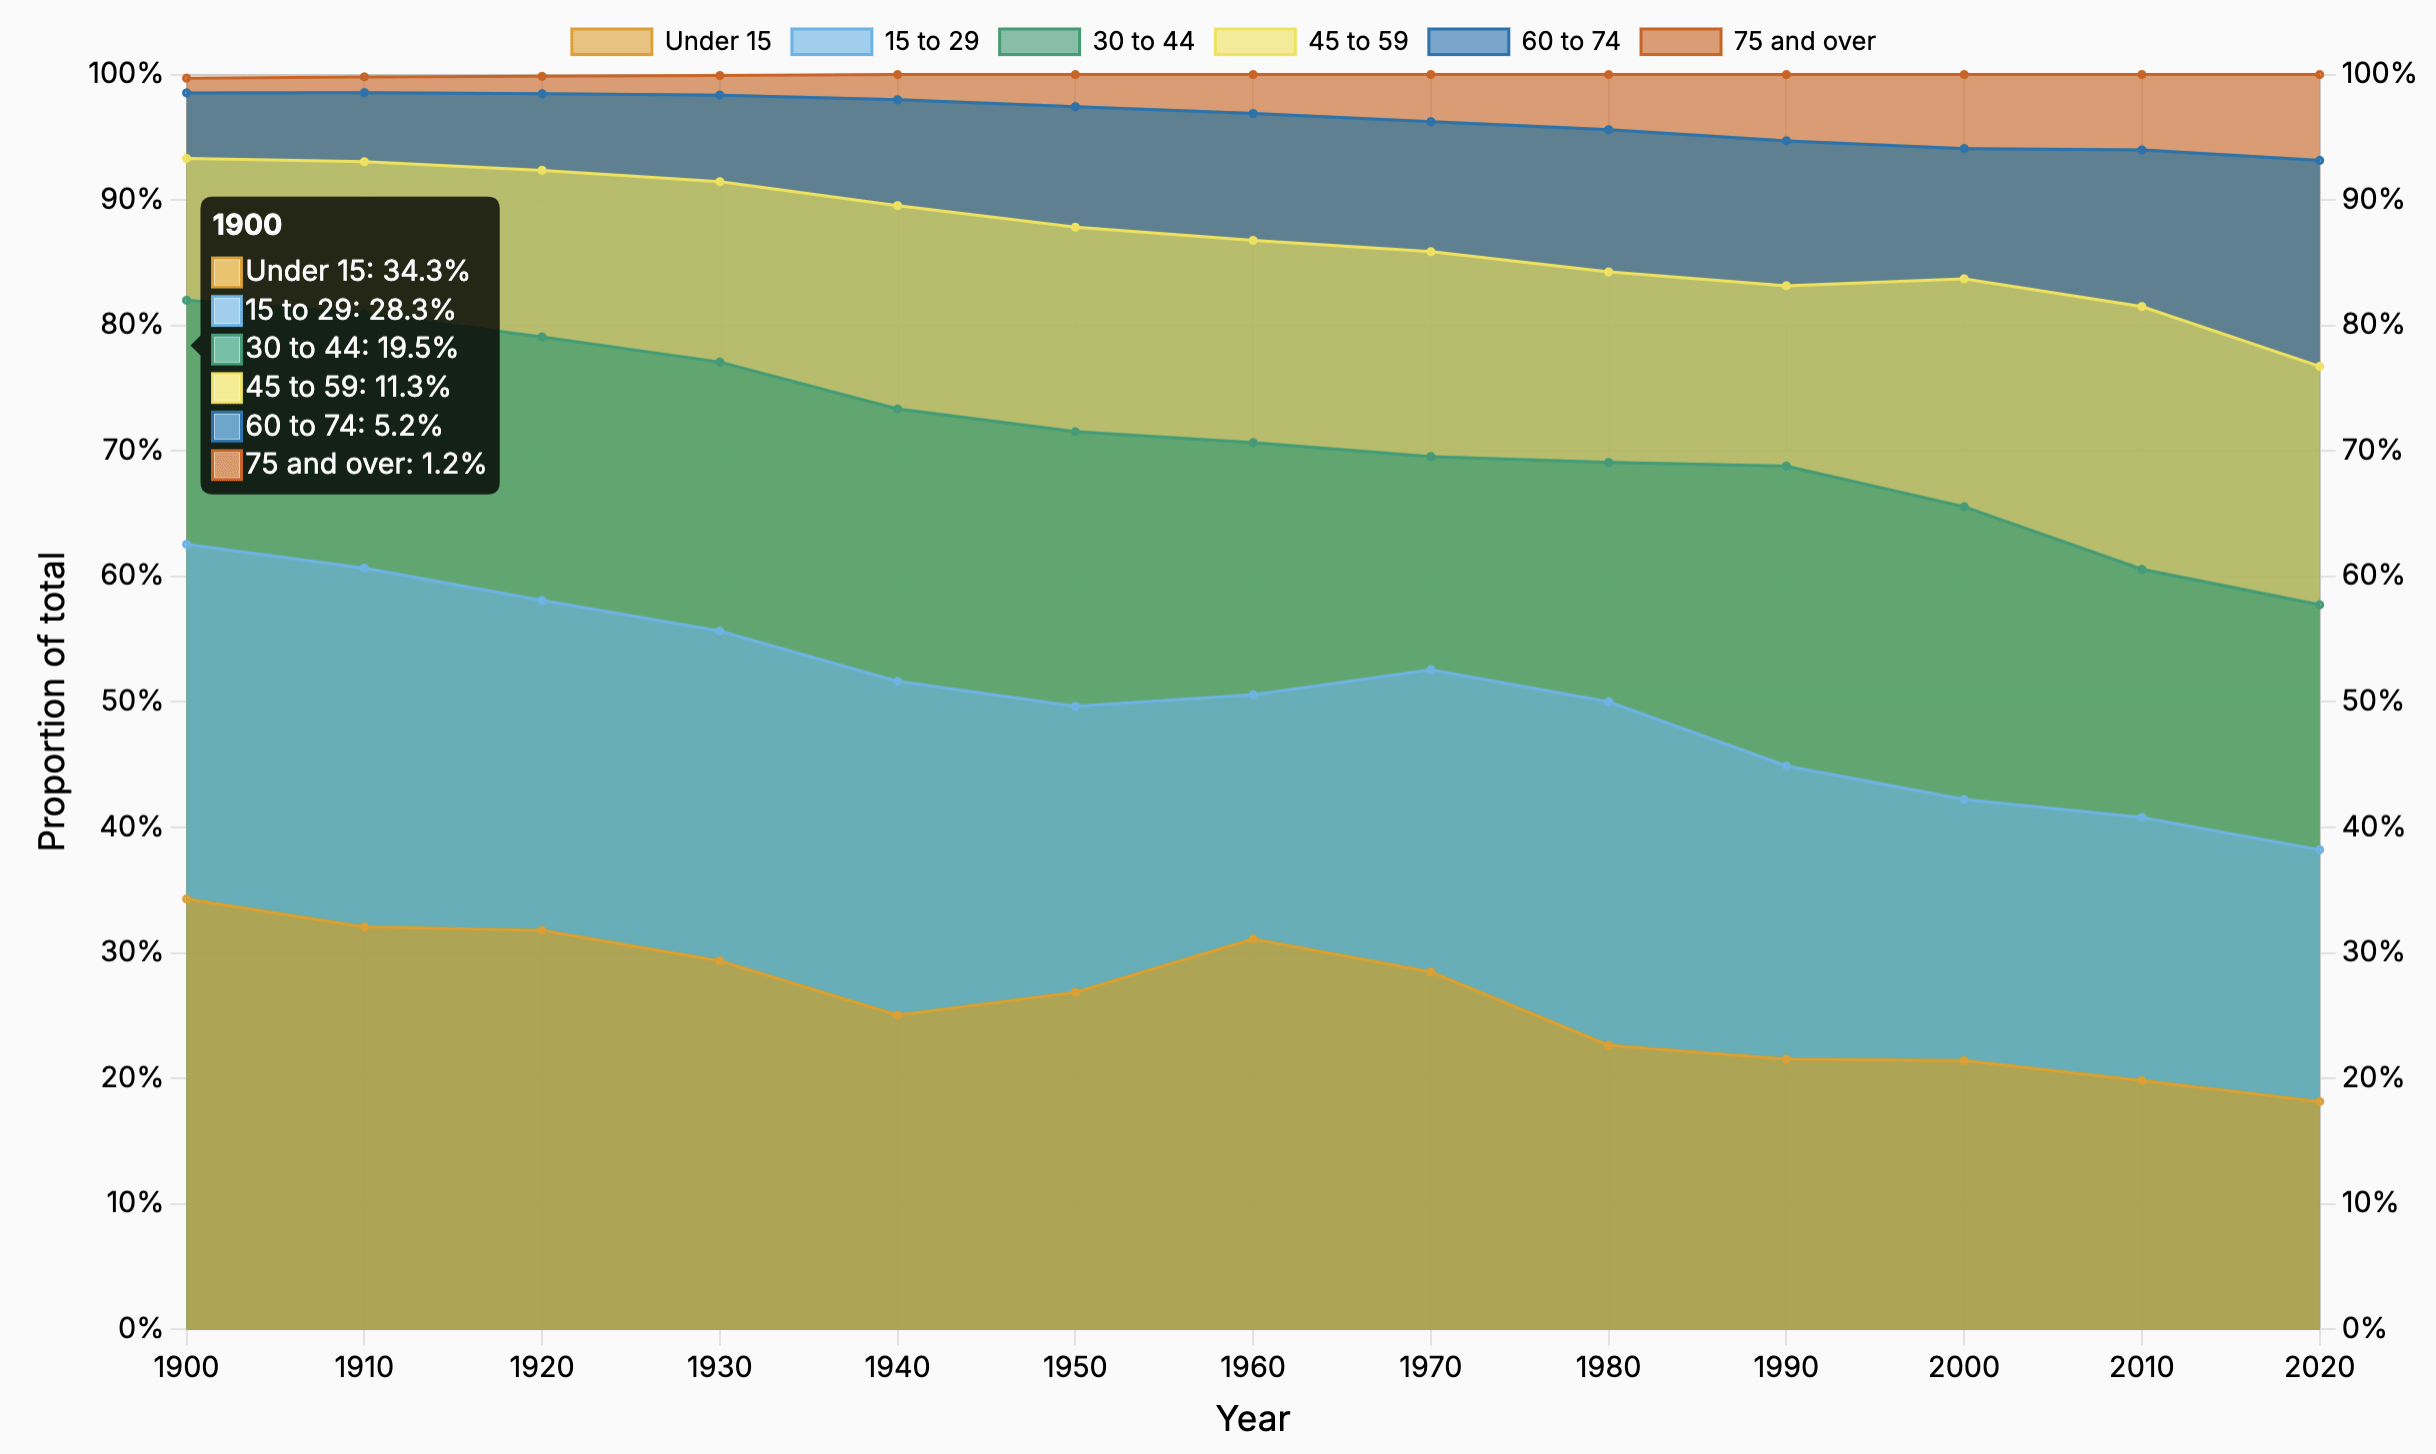
GraphCog on March 15, 2025 2:56 pm Interactive graph: [US population by age group](http://graphcog.com/us-population) Use the controls to change the number of age groups, or toggle between ratios, growth rates, and totals. Some observations: – Over 65s now account for almost 17% of the population, compared to less than 5% 100 years ago. – Total population is three times higher than 100 years ago. – Population growth has been steadily declining, to its lowest rate since World War II. Source of data: [census.gov](http://census.gov) Tool: Chart.js

![[OC] US population history, split by age group](https://www.byteseu.com/wp-content/uploads/2025/03/n29duxjiavoe1-1536x917.png "[OC] US population history, split by age group")
1 Comment
Interactive graph: [US population by age group](http://graphcog.com/us-population)
Use the controls to change the number of age groups, or toggle between ratios, growth rates, and totals.
Some observations:
– Over 65s now account for almost 17% of the population, compared to less than 5% 100 years ago.
– Total population is three times higher than 100 years ago.
– Population growth has been steadily declining, to its lowest rate since World War II.
Source of data: [census.gov](http://census.gov)
Tool: Chart.js