
![[OC] Sonar acoustic profile vs. Time at my local lake](https://www.byteseu.com/wp-content/uploads/2025/03/vyxjms6hckpe1-1536x865.jpeg "[OC] Sonar acoustic profile vs. Time at my local lake")
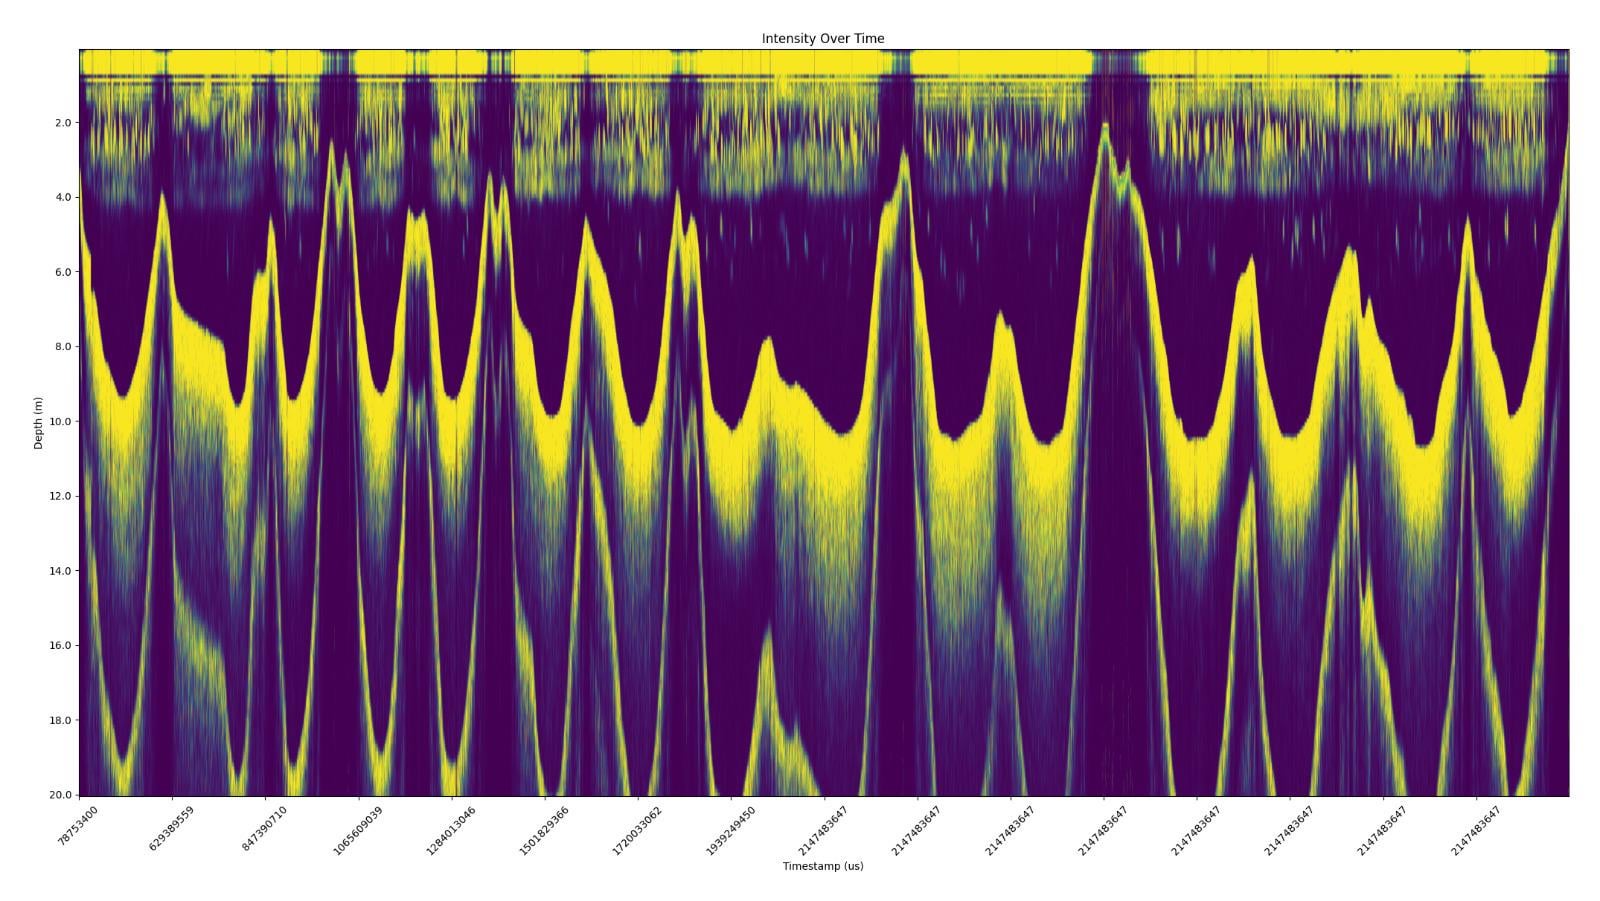
This mission was performed by a boat running ArduPilot with a BlueRobotics Echosounder mounted. Each timestamp is the time in microseconds since the boat booted up. At each instant, the sonar emits a ping, which returns an array of values between 0-255, which are colored here.
Posted by JoseSuarez
1 Comment
What do the different clusters on here mean? I assume the cluster around 10m is the lakebed, the lower one an echo of the lakebed, and the stuff near the top noise or fish or something? It’s curious there’s such a consistent cluster at the top. Curious on your take.