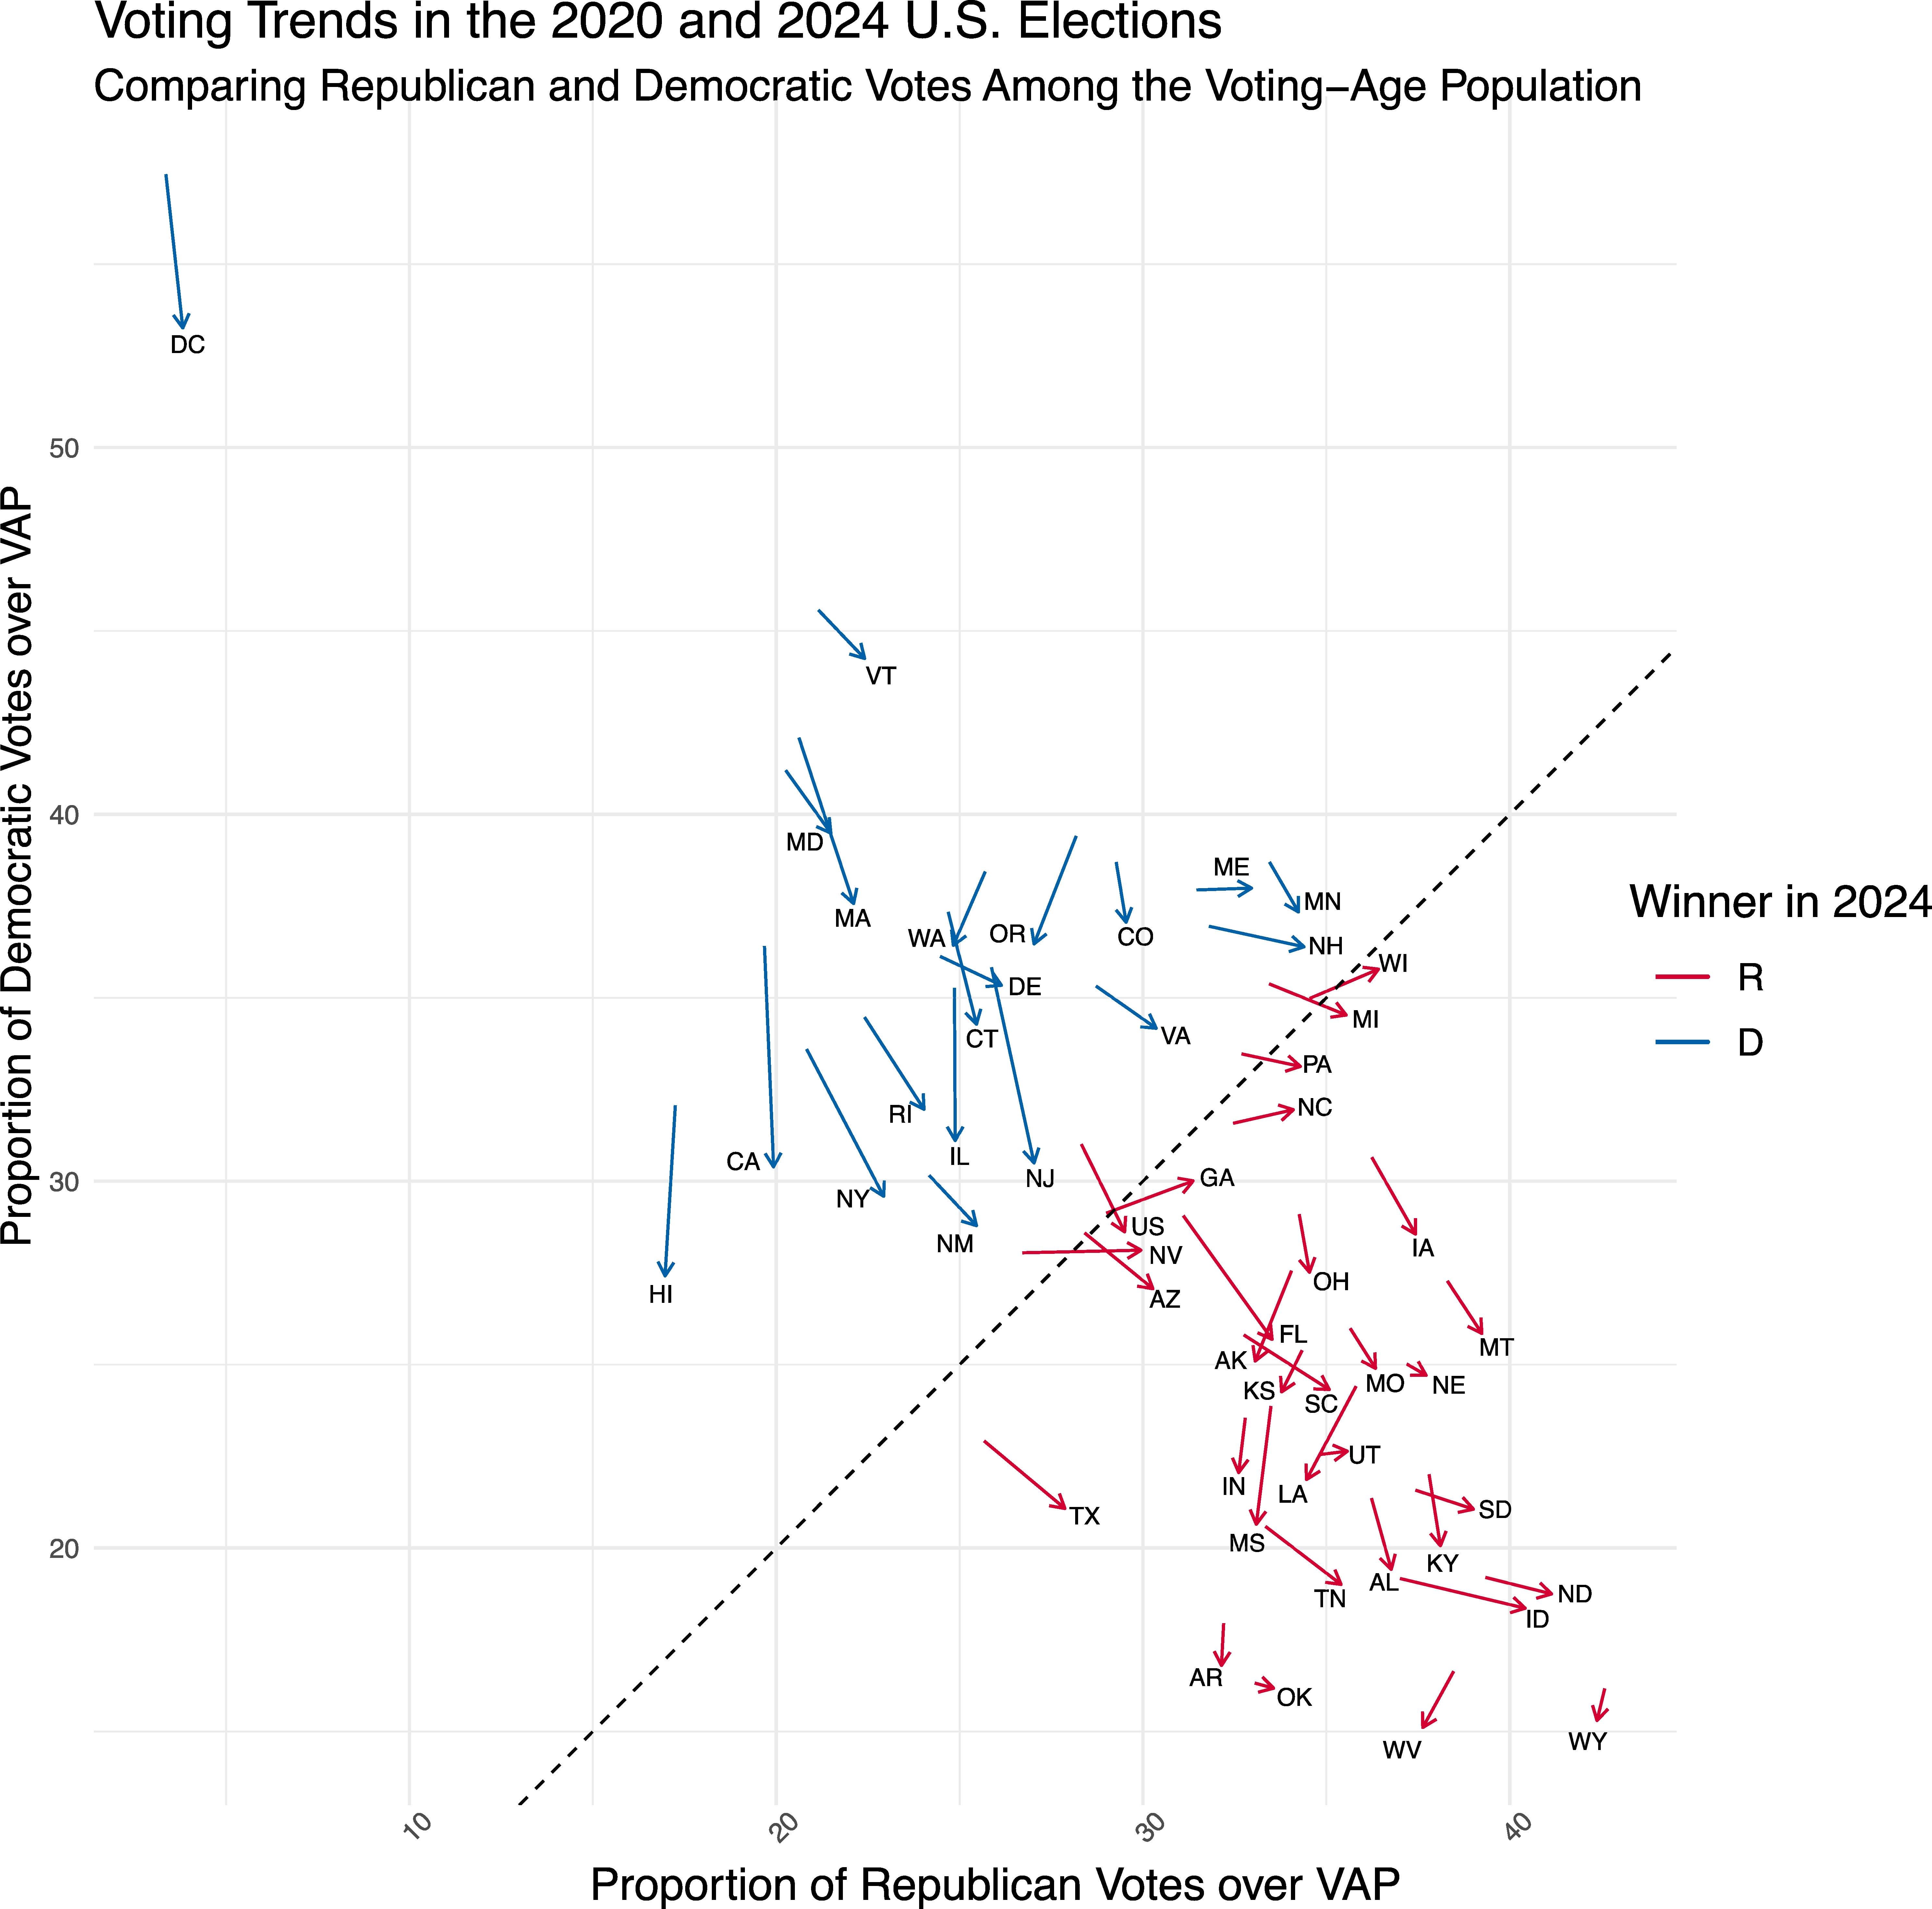
The direction of the vector indicates the shift from 2020 to 2024. Arrows pointing down suggest D voters moving to abstention, and arrows pointing down-right could be shifts from D to R or D to abstention and abstention to R. In states like California or Hawaii, many D voters didn’t vote in 2024, and republicans didn’t make gains.
wardamnbolts on
I love in CA I knew a lot of people who didn’t vote because they figure their vote doesn’t matter. I could see in swing states you probably get a lot more active voting.
columbinedaydream on
this is a nice graphic. it really shows that democrats have an enthusiasm problem, not necessarily that republicans won over voters
edit: not going to reply to every comment. this is obviously a polarizing topic. but i wanted to add that yes definitely there was a shift to the right across a lot of swing and red states, but i dont think trump would have won the popular vote if democrats had maintained enthusiasm between 2020 and 204
edit 2: if you want to ask the question: “which had more of a pronounced effect: lack of dem turnout or increased of rep turnout?” the answer is in the slope of the aggregate us line. which shows there was much less dem turnout than an increase in rep turnout
thenewbae on
Definition of “lost everywhere”
eternali17 on
This is a real fucking problem.
AffectionateYam9625 on
Well yea. What do you think would happen selecting one of the most unpopular candidates that no one wants to vote for to go against the most controversial one that half of America loves while the other half hate?
DesolationRobot on
I’m in love with this graphic. There are so many stories to suss out of this. I especially like the hash line at 50/50 to show quickly where the swing states are.
I’d love a version that could show a few election in a row with nodes.
lateformyfuneral on
Honestly, this seems like a confusing way to represent the data. We’ve been treated to a bunch of these since the election. I get this one is showing more of an issue with voter abstention due to post first-term decline in enthusiasm, but it’s not immediately obvious vs a straightforward swing to the right. I feel like it’s better to represent those two things separately
Anthrax79 on
So looking at this graph, everything everywhere shifted right. That is friggin awesome. Sadly the trend will not hold. We are stuck in a semi perpetual pendulum swing. Left Right, Right Left. It will cause constant chaos and destroy us as a nation.
Error_404_403 on
Not a SINGLE state can be found where number of those voted Democrat increased. Not a single one.
If that is not the sign of failure in policies and politics I don’t know what is. You can’t argue ALL of them – only because of the mastery of Republicans to mislead.
There indeed was a genuine failure of the Democratic leadership and the party in general to offer people solutions that they would understand matter to them.
And republicans said they could (doesn’t matter if they can’t).
Will Americans learn the lesson and transition, through much chaos and deterioration, to a more enlightened and improved democracy, or will they fall back to the times of the authoritarian guidance before the Republic?
And, by extension, is democracy something that can be instilled by a group of people once and then propagate, self-improving, or does democracy require a constant oversight of a hidden or explicit power, like in the UK, Canada or Singapore?
And where will US find itself 8 to 12 years down the road?
chicagotim1 on
This makes it clear that the election was won by people changing their vote, not the Reddit centric notion that Democrats just had lower turnout

![Shifts in Voting trends in different states 2020-2024 Elections [OC]](https://www.byteseu.com/wp-content/uploads/2025/03/00xtytztadqe1-1536x1517.jpeg "Shifts in Voting trends in different states 2020-2024 Elections [OC]")
11 Comments
Resubmitted after the wonderful suggestions by some people.
Source: Wikipedia and 2023 VAP obtained from Census.
[https://en.wikipedia.org/wiki/2020_United_States_presidential_election#Results](https://en.wikipedia.org/wiki/2020_United_States_presidential_election#Results)
[https://en.wikipedia.org/wiki/2024_United_States_presidential_election#Results](https://en.wikipedia.org/wiki/2024_United_States_presidential_election#Results)
All data available here: [https://docs.google.com/spreadsheets/d/e/2PACX-1vSi3yLygHeDQXelvJ2-4kxzG3fHemBCO9eGdvT0bJEA7LgIpYbN7cUrv47myCpveegF2RiooATisglS/pubhtml](https://docs.google.com/spreadsheets/d/e/2PACX-1vSi3yLygHeDQXelvJ2-4kxzG3fHemBCO9eGdvT0bJEA7LgIpYbN7cUrv47myCpveegF2RiooATisglS/pubhtml)
The direction of the vector indicates the shift from 2020 to 2024. Arrows pointing down suggest D voters moving to abstention, and arrows pointing down-right could be shifts from D to R or D to abstention and abstention to R. In states like California or Hawaii, many D voters didn’t vote in 2024, and republicans didn’t make gains.
I love in CA I knew a lot of people who didn’t vote because they figure their vote doesn’t matter. I could see in swing states you probably get a lot more active voting.
this is a nice graphic. it really shows that democrats have an enthusiasm problem, not necessarily that republicans won over voters
edit: not going to reply to every comment. this is obviously a polarizing topic. but i wanted to add that yes definitely there was a shift to the right across a lot of swing and red states, but i dont think trump would have won the popular vote if democrats had maintained enthusiasm between 2020 and 204
edit 2: if you want to ask the question: “which had more of a pronounced effect: lack of dem turnout or increased of rep turnout?” the answer is in the slope of the aggregate us line. which shows there was much less dem turnout than an increase in rep turnout
Definition of “lost everywhere”
This is a real fucking problem.
Well yea. What do you think would happen selecting one of the most unpopular candidates that no one wants to vote for to go against the most controversial one that half of America loves while the other half hate?
I’m in love with this graphic. There are so many stories to suss out of this. I especially like the hash line at 50/50 to show quickly where the swing states are.
I’d love a version that could show a few election in a row with nodes.
Honestly, this seems like a confusing way to represent the data. We’ve been treated to a bunch of these since the election. I get this one is showing more of an issue with voter abstention due to post first-term decline in enthusiasm, but it’s not immediately obvious vs a straightforward swing to the right. I feel like it’s better to represent those two things separately
So looking at this graph, everything everywhere shifted right. That is friggin awesome. Sadly the trend will not hold. We are stuck in a semi perpetual pendulum swing. Left Right, Right Left. It will cause constant chaos and destroy us as a nation.
Not a SINGLE state can be found where number of those voted Democrat increased. Not a single one.
If that is not the sign of failure in policies and politics I don’t know what is. You can’t argue ALL of them – only because of the mastery of Republicans to mislead.
There indeed was a genuine failure of the Democratic leadership and the party in general to offer people solutions that they would understand matter to them.
And republicans said they could (doesn’t matter if they can’t).
Will Americans learn the lesson and transition, through much chaos and deterioration, to a more enlightened and improved democracy, or will they fall back to the times of the authoritarian guidance before the Republic?
And, by extension, is democracy something that can be instilled by a group of people once and then propagate, self-improving, or does democracy require a constant oversight of a hidden or explicit power, like in the UK, Canada or Singapore?
And where will US find itself 8 to 12 years down the road?
This makes it clear that the election was won by people changing their vote, not the Reddit centric notion that Democrats just had lower turnout