CSV files containing the location data for the attacker and vicim of a given engagement, created using the awpy python package, using demo files found on [hltv.org](http://hltv.org)
dataset includes map played on de_dust2 from 2025 editions BLAST Bounty, IEM Katowice, PGL Cluj-Napoca, ESL Pro League season 21 and the group stage of BLAST Open Lisbon
tools: python (to harvest data) & R (to visualise it)
methodology:
put the X&Y location of the attacker (player doing the killing) in one CSV file, then repurposed Spencer Schien’s R code which visualized the population density in a given state into my version
Does frag mean kill or grenade? Edit – ignore me I read the image text
BlueTommyD on
Peak beautifuldata^(TM) – Top work
Nordosa on
Really cool, one of the better things I’ve seen on here recently!
RSDeuce on
Not a CS2 player. Why are so few people killed at the bottom of the map? If it is reachable I’d assume that density would be more even, but there are so few connected blocks down there.
GoodTato on
Would be curious to see this graph from before they blocked off that one sightline from T spawn down mid
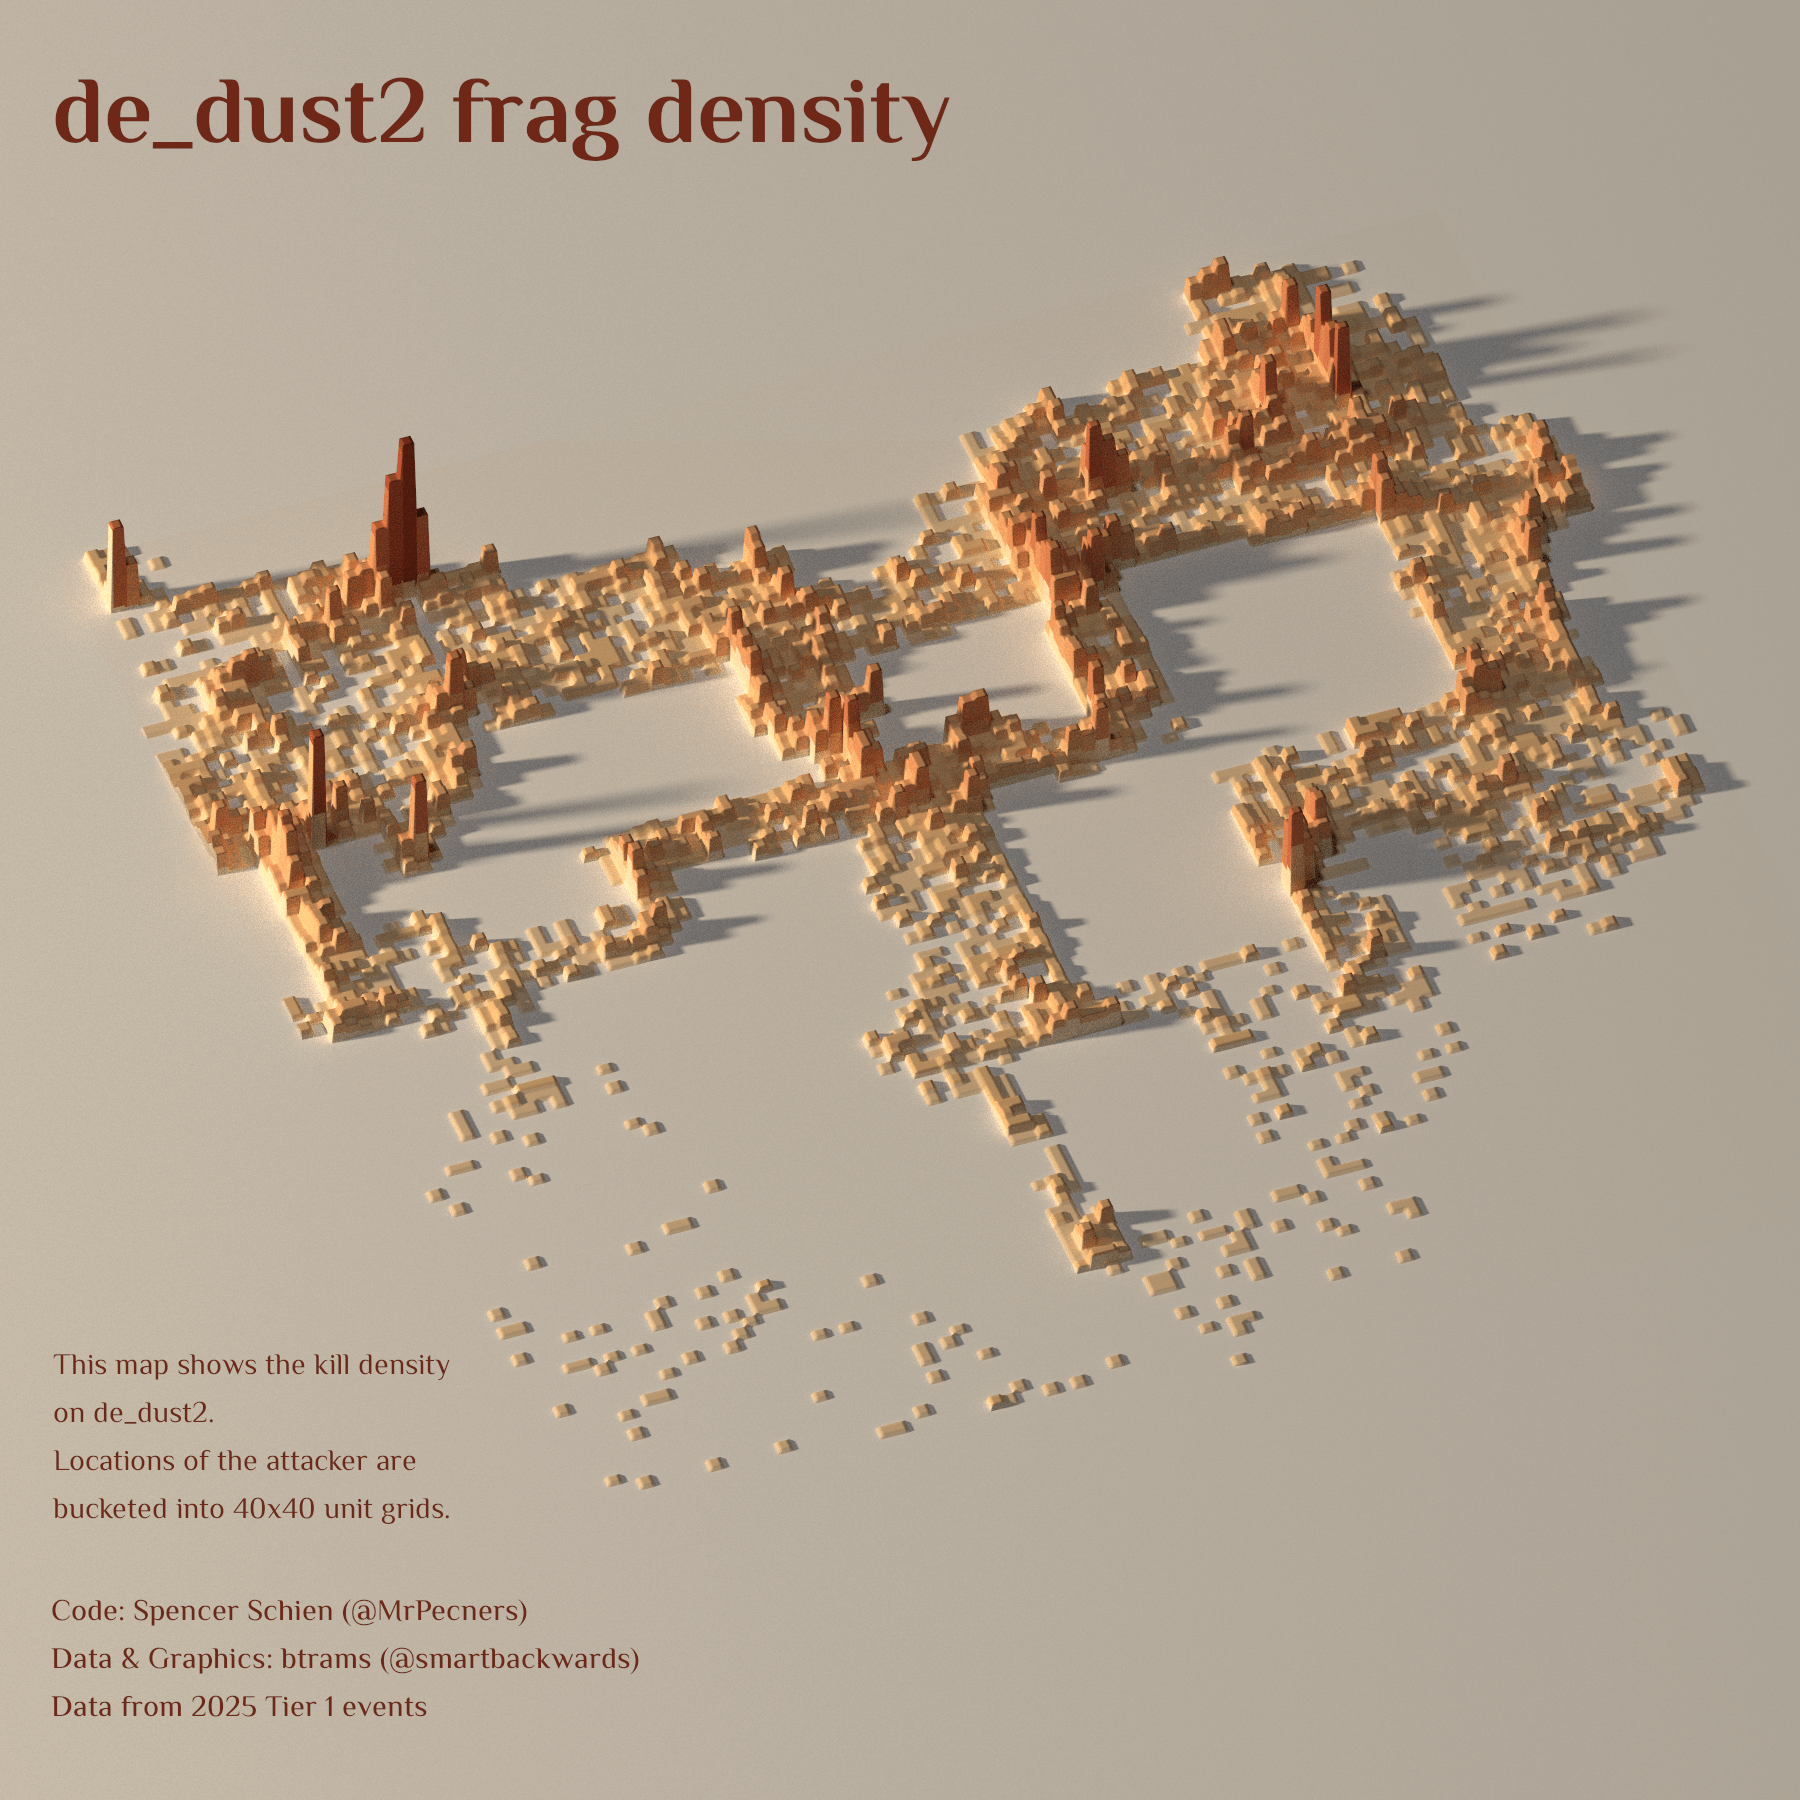

![[OC] density of the location of the frags in professional CS2 games played on de_dust2](https://www.byteseu.com/wp-content/uploads/2025/03/cc6kinr29bre1-1536x1536.png "[OC] density of the location of the frags in professional CS2 games played on de_dust2")
6 Comments
Data source:
CSV files containing the location data for the attacker and vicim of a given engagement, created using the awpy python package, using demo files found on [hltv.org](http://hltv.org)
dataset includes map played on de_dust2 from 2025 editions BLAST Bounty, IEM Katowice, PGL Cluj-Napoca, ESL Pro League season 21 and the group stage of BLAST Open Lisbon
tools: python (to harvest data) & R (to visualise it)
methodology:
put the X&Y location of the attacker (player doing the killing) in one CSV file, then repurposed Spencer Schien’s R code which visualized the population density in a given state into my version
Spencer’s website: [Spencer Schien](https://spencerschien.info/)
my code: [densitygraphic.R](https://gist.github.com/smartbackwards/2f6376dc9e669fc2773d7915e3cf663b)
original code: [kontur_rayshader_tutorial/markup.R at main · Pecners/kontur_rayshader_tutorial](https://github.com/Pecners/kontur_rayshader_tutorial/blob/main/markup.R)
Does frag mean kill or grenade? Edit – ignore me I read the image text
Peak beautifuldata^(TM) – Top work
Really cool, one of the better things I’ve seen on here recently!
Not a CS2 player. Why are so few people killed at the bottom of the map? If it is reachable I’d assume that density would be more even, but there are so few connected blocks down there.
Would be curious to see this graph from before they blocked off that one sightline from T spawn down mid