
![[OC] Long term rise of average temperature in Germany](https://www.byteseu.com/wp-content/uploads/2025/04/mqqoglkwhete1-1024x598.png "[OC] Long term rise of average temperature in Germany")
OK maybe not as beautiful as others here.
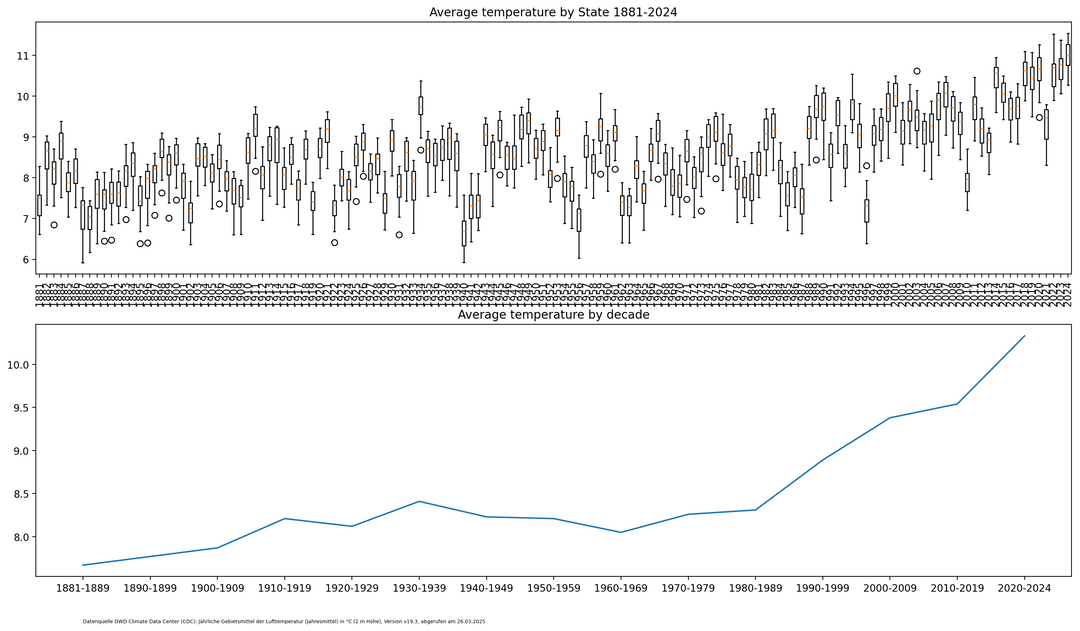
First image is a boxplot of all the average temperatures of all German states. Meaning each candle represents that year's average temperature of every state. For a better explanation see the source material below and the matplotlib documentation entry for boxplots. The second image is easier to describe. The average temperature for all of Germany for that decade. Lowest value 7.67°C for 1881-1889, highest 10.33°C for 2020-2024.
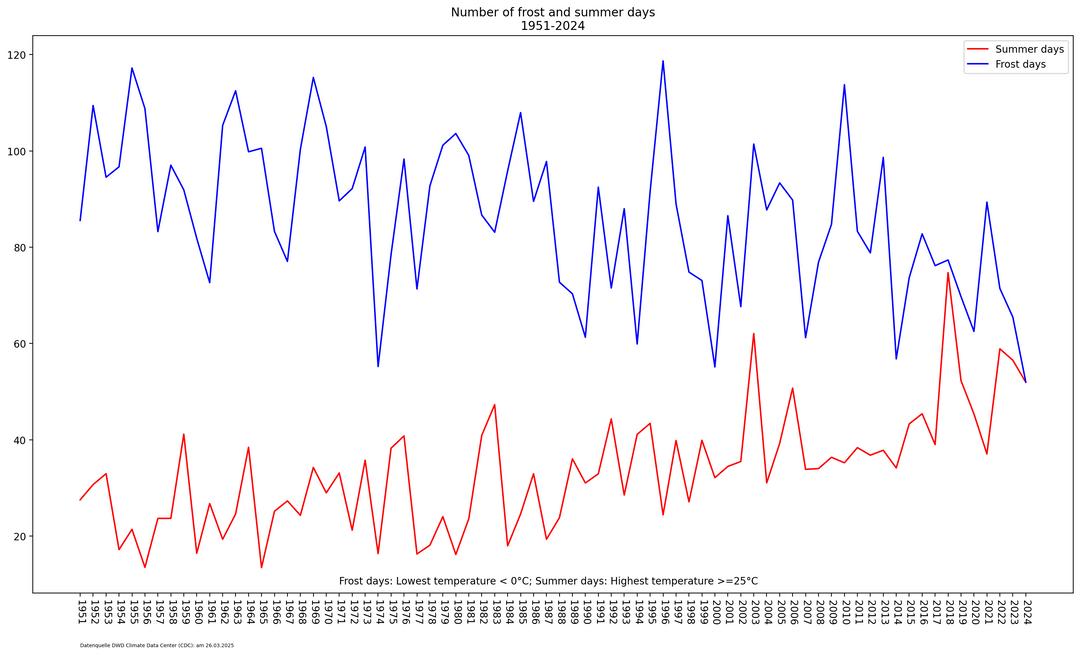
Second image shows the number of frost days (lowest temperature below 0°C) and summer days (highest temperature at least 25°C) as defined by the DWD. 2024 was the first year with about as many summer days as there were frost days (52.02 frost vs 51.95 summer).
Personal note: I wanted to play around with matplotlib and python. And weather data is a good way to get a lot of data to play around with for free. The results I got from the data seemed interesting enough that I thought I should share them with you.
Sources: First Image, Frost days, Summer days
Tools: matplotlib, Python
Posted by Glitzerndes_Einhorn
7 Comments
Wow, average temp really starts taking off somewhere between 1980 and 1990.
Also, is avg temp already 2°C higher than 1881-89? That seems pretty high.
I really appreciate the simplicity of this one :).
Suggestions are to reduce te number of years shown in the first xaxis, reduce to every fiths or so. Maybe colour the corresonding boxplot slightly to quickly link it to the shown number.
Is this somehow adjusted to the increase in amount of sensors and distribution across the area and sensitivity and signal frequency? I always feel like comparing the raw data of signals from decades, let alone centuries, apart like this can be very deceiving. If new sensors are present in an area with warmer climate that was underrepresented or not represented it will obviously skew the mean…
Nice Work!
Interesting fact about the summer/winter day aquivalent of 2024
kids if you want to have a great future career-wise then learn how to install and maintain AC – soon every house/apartment in Germany will want to have one
So does Germany have the same temperature station anomaly problem as the US?
Most of the temperature gathering stations were located “out in the countryside” where recent urban sprawl creates higher temperature logs due to the abundance of sun-baked concrete and asphalt.
There is an old Gilligan’s Island episode where the Professor and the others believed their island was sinking. Turned out Gilligan has used the Professor’s water depth sticks to trap fish and was trying to catch bigger fish in deeper water.
.
Could 2020 low summer T and low winter T have something to do with Covid and the lack of / reduced pollution?