Share Facebook Twitter LinkedIn Pinterest Bluesky Threads [OC] An interesting low positive correlation found….. Posted by aaapod
aaapod on April 10, 2025 8:24 pm Data Sources: https://uselectionatlas.org https://www.instagram.com/p/DIRn7aMOkdu/?igsh=NTc4MTIwNjQ2YQ== Chart: https://app.datawrapper.de/
Agreeable_Squash on April 10, 2025 8:28 pm 2 completely uncorrelated axes but says trump bad so give me upvotes
username_elephant on April 10, 2025 8:36 pm Both of these correlate with being cis-male. Does the effect disappear when you control for sex ratio?
ProEduJw on April 10, 2025 8:39 pm This data isn’t beautiful. I would in fact say the presentation of this data is rather ugly and confusing.
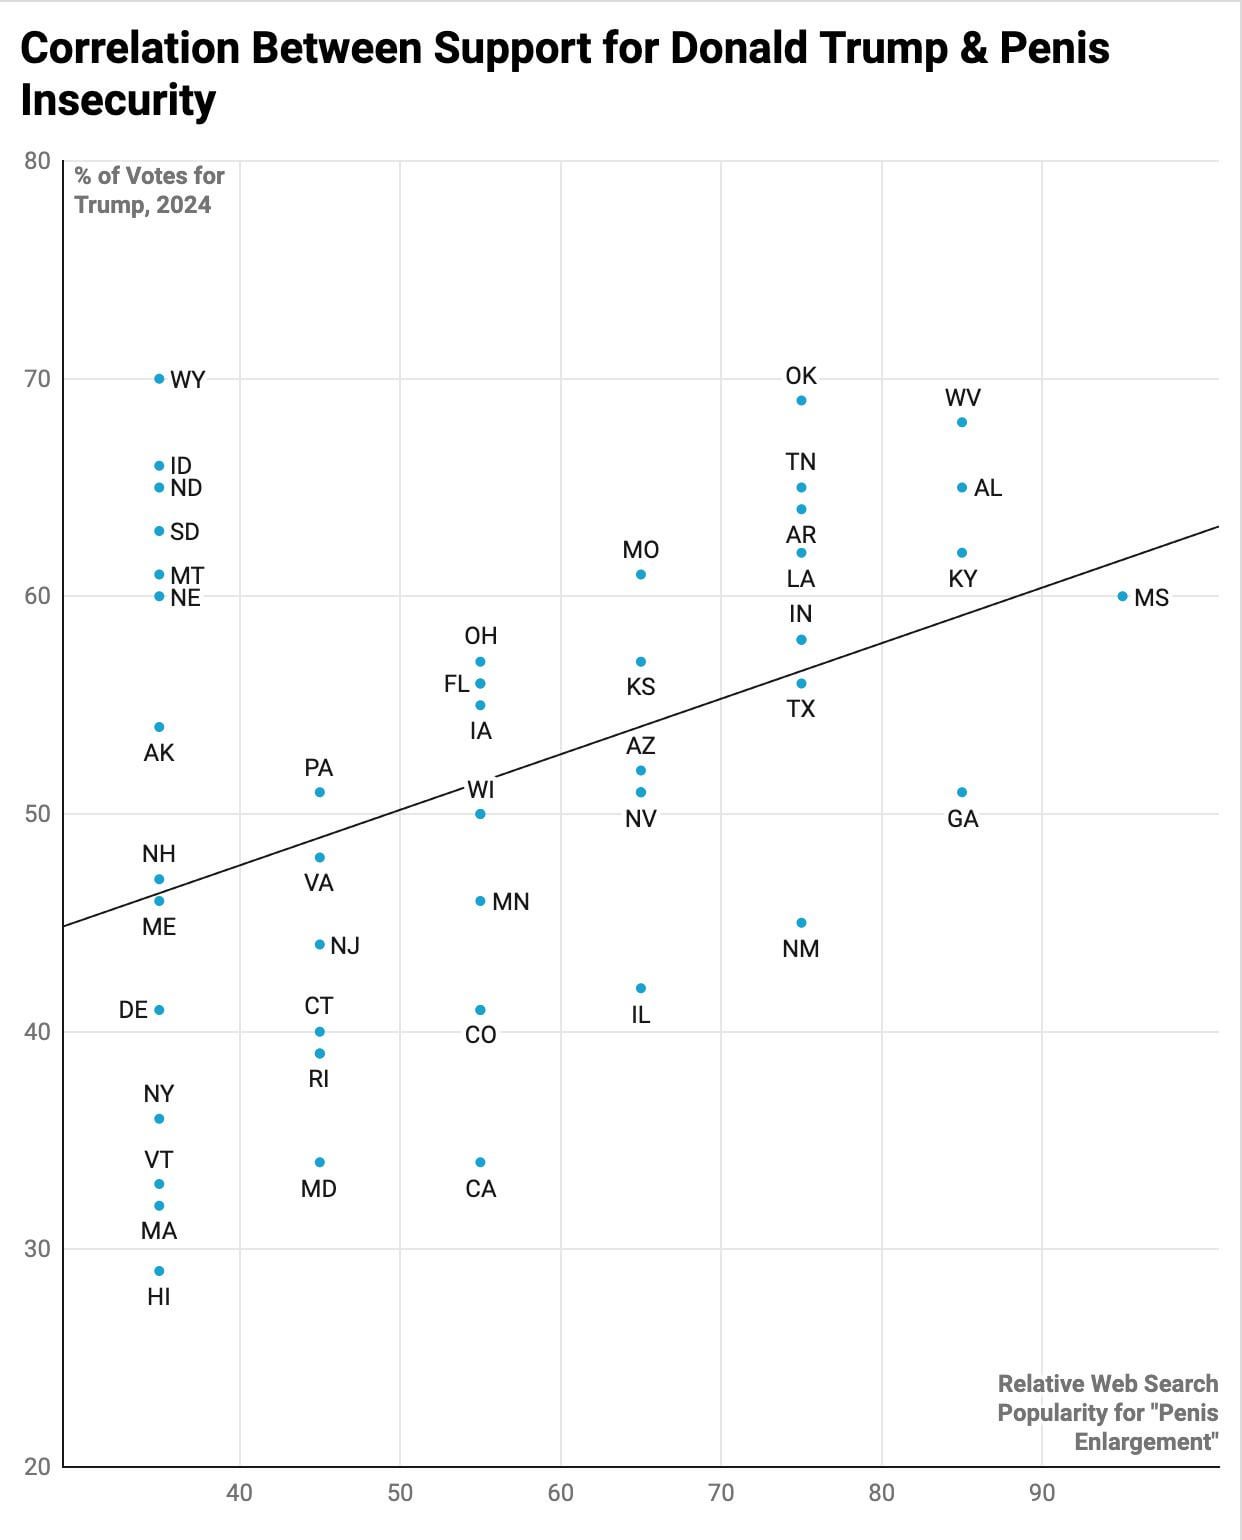
JerryVand on April 10, 2025 8:39 pm Why are all the web search data points on the 5’s (35/45/55/65/75/85/95)? Was the data bucketed, and then used the midpoint in each bucket?
Cagy_Cephalopod on April 10, 2025 8:43 pm Looks like your data sources (such as they are) contain data from all states. Why did you choose to exclude some?
mr_ji on April 10, 2025 8:58 pm Correlation between support for Trump and people who want to better please their partner(s)
aaapod on April 10, 2025 8:58 pm seems i accidentally left some states out, here’s the data set: Alabama: (85, 64.5) Alaska: (35, 53.7) Arizona: (65, 52.3) Arkansas: (75, 64.2) California: (55, 33.5) Colorado: (55, 41.1) Connecticut: (45, 39.9) Delaware: (35, 40.8) Florida: (55, 56.2) Georgia: (85, 50.7) Hawaii: (35, 29.1) Idaho: (35, 66.0) Illinois: (65, 41.9) Indiana: (75, 58.1) Iowa: (55, 55.3) Kansas: (65, 56.7) Kentucky: (85, 62.0) Louisiana: (75, 61.9) Maine: (35, 45.8) Maryland: (45, 33.6) Massachusetts: (35, 32.3) Michigan: (55, 49.6) Minnesota: (55, 46.4) Mississippi: (95, 60.4) Missouri: (65, 60.8) Montana: (35, 60.5) Nebraska: (35, 60.2) Nevada: (65, 50.6) New Hampshire: (35, 47.0) New Jersey: (45, 43.9) New Mexico: (75, 45.2) New York: (35, 36.1) North Carolina: (65, 51.1) North Dakota: (35, 65.2) Ohio: (55, 56.9) Oklahoma: (75, 68.9) Oregon: (55, 40.9) Pennsylvania: (45, 50.5) Rhode Island: (45, 39.0) South Carolina: (75, 57.7) South Dakota: (35, 63.4) Tennessee: (75, 64.5) Texas: (75, 55.7) Utah: (55, 55.9) Vermont: (35, 32.5) Virginia: (45, 47.6) Washington: (45, 38.7) West Virginia: (85, 68.1) Wisconsin: (55, 49.7) Wyoming: (35, 70.4)

![[OC] An interesting low positive correlation found…..](https://www.byteseu.com/wp-content/uploads/2025/04/2bltiac0h2ue1-1239x1536.jpeg "[OC] An interesting low positive correlation found…..")
11 Comments
Data Sources:
https://uselectionatlas.org
https://www.instagram.com/p/DIRn7aMOkdu/?igsh=NTc4MTIwNjQ2YQ==
Chart: https://app.datawrapper.de/
2 completely uncorrelated axes but says trump bad so give me upvotes
Is a p-value available from your analysis?
Both of these correlate with being cis-male. Does the effect disappear when you control for sex ratio?
This data isn’t beautiful. I would in fact say the presentation of this data is rather ugly and confusing.
Why are all the web search data points on the 5’s (35/45/55/65/75/85/95)? Was the data bucketed, and then used the midpoint in each bucket?
Are these only red states? Noticed a few missing.
Looks like your data sources (such as they are) contain data from all states. Why did you choose to exclude some?
Ah yes let’s make fun of penis, haha so funny
Correlation between support for Trump and people who want to better please their partner(s)
seems i accidentally left some states out, here’s the data set:
Alabama: (85, 64.5)
Alaska: (35, 53.7)
Arizona: (65, 52.3)
Arkansas: (75, 64.2)
California: (55, 33.5)
Colorado: (55, 41.1)
Connecticut: (45, 39.9)
Delaware: (35, 40.8)
Florida: (55, 56.2)
Georgia: (85, 50.7)
Hawaii: (35, 29.1)
Idaho: (35, 66.0)
Illinois: (65, 41.9)
Indiana: (75, 58.1)
Iowa: (55, 55.3)
Kansas: (65, 56.7)
Kentucky: (85, 62.0)
Louisiana: (75, 61.9)
Maine: (35, 45.8)
Maryland: (45, 33.6)
Massachusetts: (35, 32.3)
Michigan: (55, 49.6)
Minnesota: (55, 46.4)
Mississippi: (95, 60.4)
Missouri: (65, 60.8)
Montana: (35, 60.5)
Nebraska: (35, 60.2)
Nevada: (65, 50.6)
New Hampshire: (35, 47.0)
New Jersey: (45, 43.9)
New Mexico: (75, 45.2)
New York: (35, 36.1)
North Carolina: (65, 51.1)
North Dakota: (35, 65.2)
Ohio: (55, 56.9)
Oklahoma: (75, 68.9)
Oregon: (55, 40.9)
Pennsylvania: (45, 50.5)
Rhode Island: (45, 39.0)
South Carolina: (75, 57.7)
South Dakota: (35, 63.4)
Tennessee: (75, 64.5)
Texas: (75, 55.7)
Utah: (55, 55.9)
Vermont: (35, 32.5)
Virginia: (45, 47.6)
Washington: (45, 38.7)
West Virginia: (85, 68.1)
Wisconsin: (55, 49.7)
Wyoming: (35, 70.4)