It appears to start declining much sooner than that, around 2012 and the advent of the smartphone.
USAFacts on
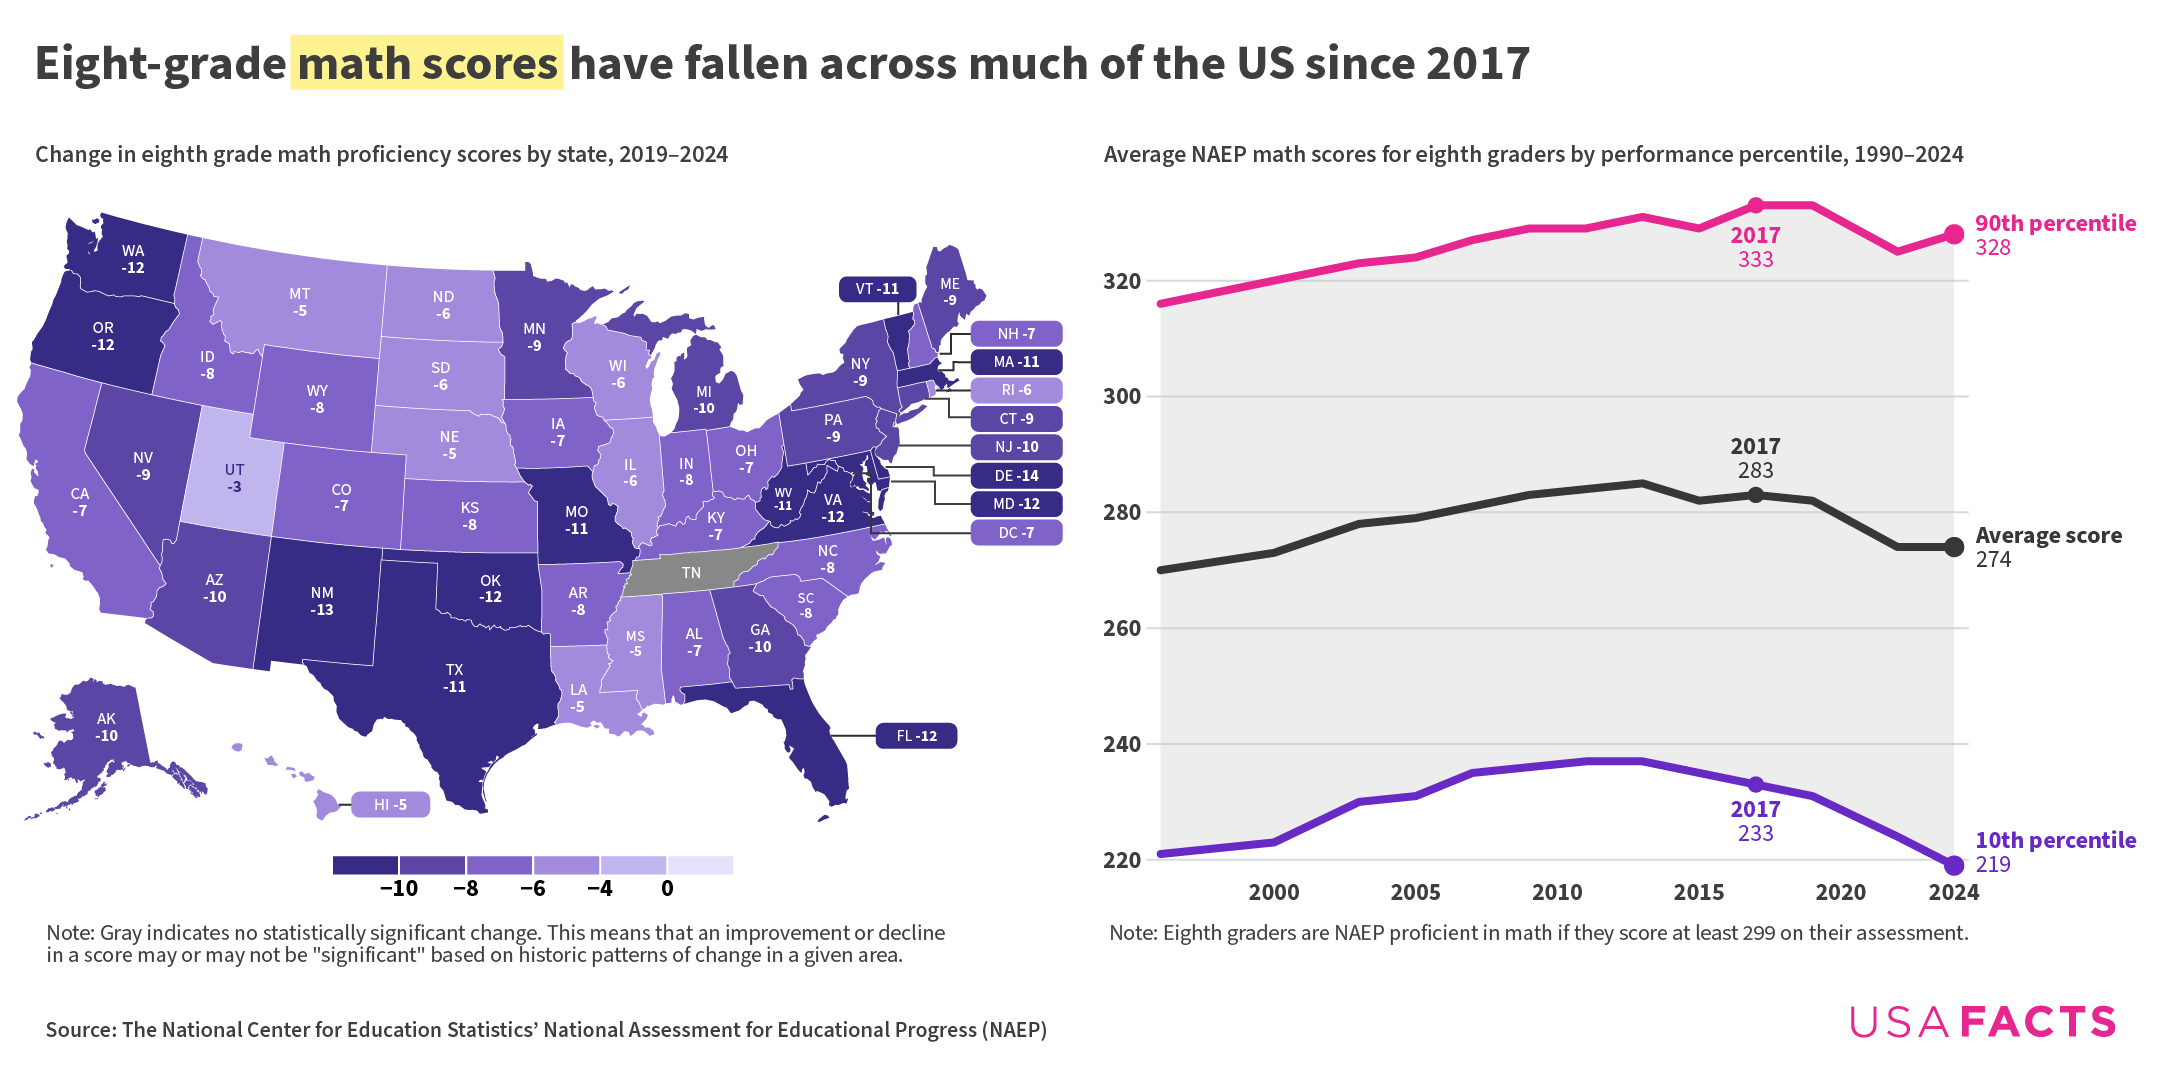
The 2024 Nation’s Report Card (aka the National Assessment for Education Progress or NAEP) tested about 111,000 eighth graders in math on a 0-500 scale (299 = “proficient”). The national average score was 274, unchanged from 2022 but nine points below 2017’s peak of 283. Forty-nine states plus Washington, DC, have seen statistically significant declines since 2019; Tennessee is the lone exception.
Score changes were not uniform across students:
* High performers (90th percentile) gained 2–3 points from 2022, reaching 328.
* Low performers (10th percentile) fell 2–5 points, landing at 219.
* The share of students meeting the proficiency bar was 28 % in 2024, up two points from 2022 yet still six points below 2019.
Edit: I obviously misspelled “eighth” in the chart title on purpose as a funny joke about proficiency. It was definitely not a mistake. Definitely not… oof.
cschris54321 on
How have the demographics changed among 8th grades since 2012 when the scores began to fall?
PornstarVirgin on
Does Tennessee not have math?
person2567 on
I wonder how much this has to do with the proliferation of cheating technology
attilla68 on
the textbooks on import tariffs are probably dated
tristanjones on
So how big is this gap in context? What does a 320 v a 220 score look like?
Quinnvannice on
I was a 8th grader in 2017 at an above average public school and considering how bad most people were at math, this is frightening. Covid lockdown did a number on all students development, but current 8th graders who were developing basic math skills at the time were probably hit the hardest. Not shocking but certainly sad.
TonyzTone on
If there’s one silver lining in these charts is that it shows COVID barely affected the trend of average and 10th percentile scores. They were already getting bad, and continued that way.
hyper_forest on
If those kids could read this chart they would be very upset .
John_Brickermann on
Tennessee does not believe in math.
Ron__T on
Can’t decide if this is a “kids theses days” post or America bad free upvotes to the left post.
First: NAEP is a legacy of the failed no child left behind act, I don’t think we should be taking it seriously. They also have massive problems with marking answers wrong/right incorrectly because their testing is so bad.
Second: NAEP testing is not done universally, instead it is a “sample” which is often poorly distributed.
Third: Schools don’t use NAEP testing for grades, mainly because it’s a horrible test. As someone that took one of these tests before, we were told that it didn’t count for a grade, and it gets annoymonized. Our teacher told us something like, “I have been told to ask you to take it seriously and to treat it like a real test.” Anyone that used to be 12 years old can tell you how seriously a 12 year old takes the test.
Fourth: This isn’t an apples to apples measurement. What was “proficient” in 2000 is much easier than what is considered “proficient” in 2025.
Fifth: Newer NAEP testing controls and breaks out children on 504/IEP that need accommodations, and grades them. It’s not clear which one you used, accommodations or non accommodations. But in the past, children with special needs would just not take the test. I think you could see the problem with not including this group in the past but now including them.
LineOfInquiry on
I mean Covid was a pretty extreme time, idk if I’d count the obvious dip that would occur during and after that against the system. But a decline before that is concerning.
We really need a United national curriculum, longer schooldays, a shortened summer break, and more investment in teachers.
FridayInc on
“You’re not always going to have a calculator in your pocket” was no longer sound reason by the time Gen Z got to middle school. When was the last time you saw anyone do math without at least checking it on a computer? It’s a little sad but not surprising.
TheGenjuro on
Incredibly interesting data and this trend is definitely true (math teacher perspective), but there are multiple issues with the validity of the data.
One year, i sent an email home to parents telling them their rights regarding state testing and gave links on what the data is used for and how to opt out. We had a high percentage of students opt out. The state’s response: if 10% or more parents exercise their rights and opt their students out of state testing, your school report card score drops 5 points. The solution: take the test but it literally doesn’t affect you so go ahead and randomly guess.
People just don’t care. Why should a student try their hardest when they get nothing in return? Do you work overtime for a “thank you” note written by the governor? These kids are educated enough in knowing their rights and not appeasing others for no benefit.
I know I’m comparing state v federal systems, but it’s the same issue – kids are taken out of classes to take the NAEP and are not excused from work they missed.
yerguyses on
If my math is correct, my state is one of the worst! But since I’m from that state, don’t count on my math.
Rough-Yard5642 on
The more interesting part to me is the divergence between the top 10% and the bottom 10%. I have heard that low income families are worse at keeping screen time limited for their kids, which intuitively would explain this data. I feel like that ‘reversal’ in the 90th percentile is higher income parents finally realizing that screen time is bad, and actually limiting it. Schools are also starting to do this, but that will take time to show up in the data IMO.
maveri4201 on
All three of those levels seem to revert back to the 2000 mean. Do we know this isn’t just the rise and decline of “teaching to the test?”
TinKicker on
AI will solve this. (The test scores, not the dumbing of America)
Throwingawaymarlboro on
Now let’s throw in smartphone usage to see if there’s a correlation.
Unco_Slam on
These 8th graders would be voting age by now…
seedless0 on
Our town publishes student accessment results each year. One year, the sum of all levels of proficiency in science summed up to 101%.
So it’s not just 8th graders.
forevabronze on
the decline starts right when smart phones and social media boom began 2012 ish
Helpful-Worldliness9 on
is there a genuine reason as to why it varies per state – for example California (D) -7 and Utah (R) -3, while virgina (D) -12 and Texas (R) -11
Tommy_Wisseau_burner on
This doesn’t tell you much? Is this normalized across all states because there’s no national test/standard. For instance you’d have to take the GEPA, in New Jersey, and compare that to whatever the eighth grade test is in every other state, if there is one, and see what the change is.
Available-Risk-5918 on
How come Utah had such a small decline relative to other states?
dbowman97 on
Covid learning gap is real for the lowest learners. Kids who were already at risk didn’t have home supports to accommodate a year or more of at-home learning fell further behind.

![[OC] Declining eighth-grade math proficiency in the US](https://www.byteseu.com/wp-content/uploads/2025/04/eexorcbu01ye1-1536x766.png "[OC] Declining eighth-grade math proficiency in the US")
28 Comments
Source: [National Center for Education Statistics](https://www.nationsreportcard.gov/reports/mathematics/2024/g4_8/national-trends/?grade=8)
Tools: Datawrapper, Illustrator
More data on fourth- and eighth-grade math and reading scores [here](https://usafacts.org/articles/covid-disrupted-decades-of-progress-in-math-and-reading/).
It appears to start declining much sooner than that, around 2012 and the advent of the smartphone.
The 2024 Nation’s Report Card (aka the National Assessment for Education Progress or NAEP) tested about 111,000 eighth graders in math on a 0-500 scale (299 = “proficient”). The national average score was 274, unchanged from 2022 but nine points below 2017’s peak of 283. Forty-nine states plus Washington, DC, have seen statistically significant declines since 2019; Tennessee is the lone exception.
Score changes were not uniform across students:
* High performers (90th percentile) gained 2–3 points from 2022, reaching 328.
* Low performers (10th percentile) fell 2–5 points, landing at 219.
* The share of students meeting the proficiency bar was 28 % in 2024, up two points from 2022 yet still six points below 2019.
More data (including a look at reading scores, which also declined in 38 states) [here](https://usafacts.org/articles/covid-disrupted-decades-of-progress-in-math-and-reading/) if you’re curious!
Edit: I obviously misspelled “eighth” in the chart title on purpose as a funny joke about proficiency. It was definitely not a mistake. Definitely not… oof.
How have the demographics changed among 8th grades since 2012 when the scores began to fall?
Does Tennessee not have math?
I wonder how much this has to do with the proliferation of cheating technology
the textbooks on import tariffs are probably dated
So how big is this gap in context? What does a 320 v a 220 score look like?
I was a 8th grader in 2017 at an above average public school and considering how bad most people were at math, this is frightening. Covid lockdown did a number on all students development, but current 8th graders who were developing basic math skills at the time were probably hit the hardest. Not shocking but certainly sad.
If there’s one silver lining in these charts is that it shows COVID barely affected the trend of average and 10th percentile scores. They were already getting bad, and continued that way.
If those kids could read this chart they would be very upset .
Tennessee does not believe in math.
Can’t decide if this is a “kids theses days” post or America bad free upvotes to the left post.
First: NAEP is a legacy of the failed no child left behind act, I don’t think we should be taking it seriously. They also have massive problems with marking answers wrong/right incorrectly because their testing is so bad.
Second: NAEP testing is not done universally, instead it is a “sample” which is often poorly distributed.
Third: Schools don’t use NAEP testing for grades, mainly because it’s a horrible test. As someone that took one of these tests before, we were told that it didn’t count for a grade, and it gets annoymonized. Our teacher told us something like, “I have been told to ask you to take it seriously and to treat it like a real test.” Anyone that used to be 12 years old can tell you how seriously a 12 year old takes the test.
Fourth: This isn’t an apples to apples measurement. What was “proficient” in 2000 is much easier than what is considered “proficient” in 2025.
Fifth: Newer NAEP testing controls and breaks out children on 504/IEP that need accommodations, and grades them. It’s not clear which one you used, accommodations or non accommodations. But in the past, children with special needs would just not take the test. I think you could see the problem with not including this group in the past but now including them.
I mean Covid was a pretty extreme time, idk if I’d count the obvious dip that would occur during and after that against the system. But a decline before that is concerning.
We really need a United national curriculum, longer schooldays, a shortened summer break, and more investment in teachers.
“You’re not always going to have a calculator in your pocket” was no longer sound reason by the time Gen Z got to middle school. When was the last time you saw anyone do math without at least checking it on a computer? It’s a little sad but not surprising.
Incredibly interesting data and this trend is definitely true (math teacher perspective), but there are multiple issues with the validity of the data.
One year, i sent an email home to parents telling them their rights regarding state testing and gave links on what the data is used for and how to opt out. We had a high percentage of students opt out. The state’s response: if 10% or more parents exercise their rights and opt their students out of state testing, your school report card score drops 5 points. The solution: take the test but it literally doesn’t affect you so go ahead and randomly guess.
People just don’t care. Why should a student try their hardest when they get nothing in return? Do you work overtime for a “thank you” note written by the governor? These kids are educated enough in knowing their rights and not appeasing others for no benefit.
I know I’m comparing state v federal systems, but it’s the same issue – kids are taken out of classes to take the NAEP and are not excused from work they missed.
If my math is correct, my state is one of the worst! But since I’m from that state, don’t count on my math.
The more interesting part to me is the divergence between the top 10% and the bottom 10%. I have heard that low income families are worse at keeping screen time limited for their kids, which intuitively would explain this data. I feel like that ‘reversal’ in the 90th percentile is higher income parents finally realizing that screen time is bad, and actually limiting it. Schools are also starting to do this, but that will take time to show up in the data IMO.
All three of those levels seem to revert back to the 2000 mean. Do we know this isn’t just the rise and decline of “teaching to the test?”
AI will solve this. (The test scores, not the dumbing of America)
Now let’s throw in smartphone usage to see if there’s a correlation.
These 8th graders would be voting age by now…
Our town publishes student accessment results each year. One year, the sum of all levels of proficiency in science summed up to 101%.
So it’s not just 8th graders.
the decline starts right when smart phones and social media boom began 2012 ish
is there a genuine reason as to why it varies per state – for example California (D) -7 and Utah (R) -3, while virgina (D) -12 and Texas (R) -11
This doesn’t tell you much? Is this normalized across all states because there’s no national test/standard. For instance you’d have to take the GEPA, in New Jersey, and compare that to whatever the eighth grade test is in every other state, if there is one, and see what the change is.
How come Utah had such a small decline relative to other states?
Covid learning gap is real for the lowest learners. Kids who were already at risk didn’t have home supports to accommodate a year or more of at-home learning fell further behind.