
![[OC] I recorded 2 months of my working cycles to see where my time goes.](https://www.byteseu.com/wp-content/uploads/2025/05/bq455jp3sxye1-744x1024.jpeg "[OC] I recorded 2 months of my working cycles to see where my time goes.")
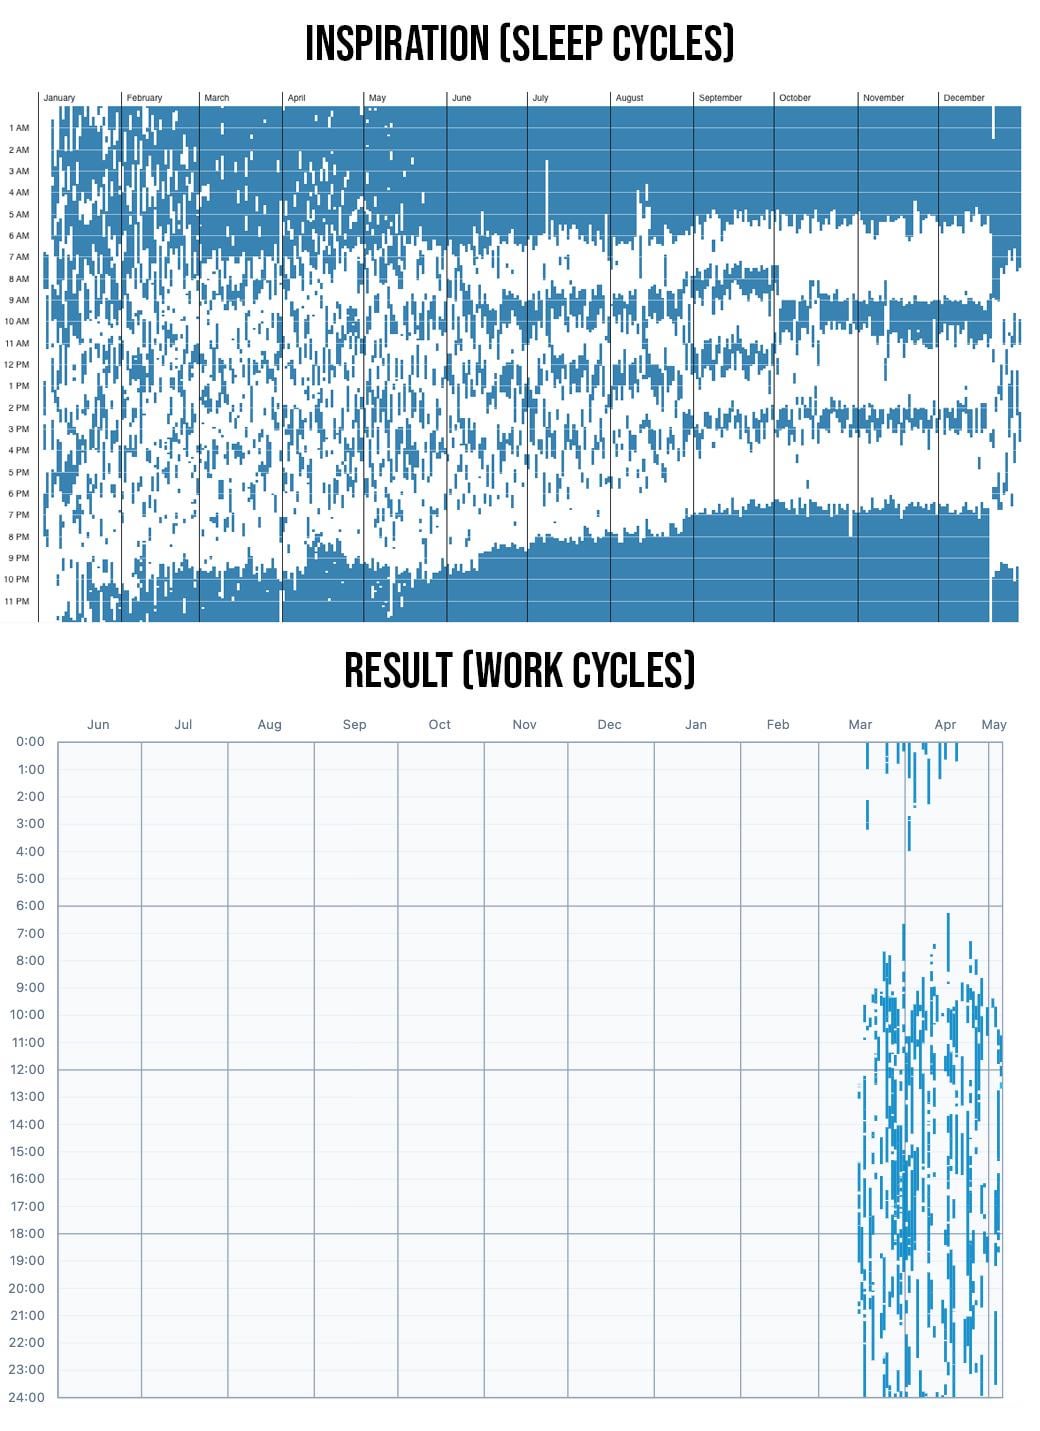
I got inspired by the sleep cycles graph in the first picture.
Once you measure something, you can see patterns and start improving. In the first picture, you can see how they improved their sleep by sleeping earlier.
The second graph is the one I made to track my work cycles. I would like to work more in the morning and sleep early, but it looks like I'm still struggling with this.
The best part is that it's already integrated with all my tasks: I record the time when I start a task so that once I click "Start", I don't interrupt myself with all kinds of distractions. It's a commitment similar to the Pomodoro Technique.
Since I already have the data, I use it to generate that graph and see my patterns.
Those little bars can be hovered in order to see what task you did. I also made a "monthly" and "weekly" view, but I like the yearly view much more because I can see how it changes based on daylight, travel, or certain decisions.
If anyone wants to monitor their working patterns, I made this available for free! (+ your tasks are end-to-end encrypted, so that I cannot read your goals/tasks). Last time I was asked the name of my website where you can do this: it's called PerspecTask.
Posted by alexand_ro
6 Comments
Why is 80% of your graph empty?
Was the first graph made by a cat? Who sleeps for 10 hours a night and then has two to three hour long naps in the day?
That doesn’t seem very healthy…
Are you a freelancer? Looks like you are a procrastinator but spending more time overall being occupied during the whole day.
Turns out you work during the day and sleep at night.
Data is beautiful, but a good night of sleep is even better.