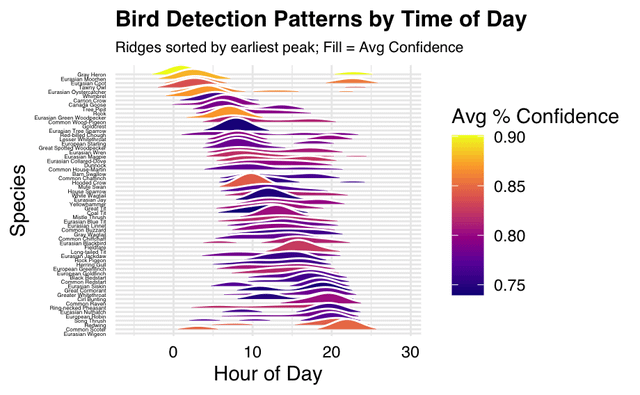

Ridgeline type plot of first month of the bird net pi detections in my uk garden. Looked quite neat so I couldn't resist a joy-division spoof.
Data from my Birdnet Pi, processed in R as part of my attempt at learning R.
Posted by Gravitykarma

Ridgeline type plot of first month of the bird net pi detections in my uk garden. Looked quite neat so I couldn't resist a joy-division spoof.
Data from my Birdnet Pi, processed in R as part of my attempt at learning R.
Posted by Gravitykarma
4 Comments
Data source: My Birdnet-Pi
Tool: RStudio using the tidy verse packages.
I can’t zoom in enough for the left image to read it. Is Roseate Spoonbill in there?
You may want to cross-post this to /r/dropout for some easy karma points.
I’m not surprised that there are no bird sitings at the 30th hour of the day.
Well done! The look of it is so perfect for this sub. We don’t see a lot of the posts with actual art anymore.
I would give something If I spent money on Reddit